River Pollutants Monitored with GIS (Analyzing the Environmental Impact of Water Bodies in Russia)

  • GIS-based information medium assessment system analyzes water body quality data.
  • Researchers monitor and visualize pollutant levels through maps, tables, and charts.
  • Data serves as a basis for making ecological and environmental decisions.
A crucial aspect of environmental policy is to review and assess human impacts of all types. GIS plays an important role in achieving this task when monitoring and analyzing the adverse environmental impact on water bodies, such as lakes, rivers, and bays. For example, a GIS can facilitate an evaluation of pollution sources by generating reports and managing data about polluters, results of measurements, reference materials providing classification of hazardous groups, and concentrations of hazardous substances in a specific river or an entire aquatic system. A GIS can also provide the tools to identify the most hazardous contaminants with regard to ecological regulations and contribute to effective decision making to ensure that natural resources are preserved and utilized correctly.
click to enlarge
Data translated into charts shows that the Neva River is polluted with petroleum products, nitrites, and iron salts.

Due to the advanced spatial visualization and analysis capabilities of GIS, researchers at Saint Petersburg Electrotechnical University (ETU) in Russia are able to map and study natural water bodies; their polluters; the source, location, and levels of polluting agents; and the content of the pollutants. Their analysis of natural water bodies and industrial enterprises provides the opportunity to predict the level of industrial impact and study various scenarios to make recommendations for rational use of natural water resources.

For the purpose of its water bodies study, ETU's GIS incorporates databases, models, calculation methods, and directives in the form of an integrated information medium for obtaining integrated data. This system design enables researchers to review and perform the following tasks:

GIS Helps Save a Coastal Plain From Land Subsidence (Japan)


click to see enlargement
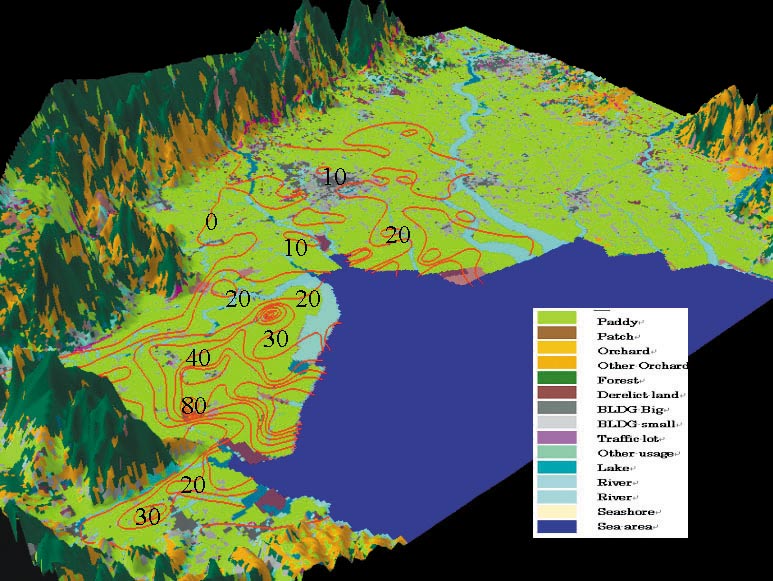
Three-dimensional land use map of the Saga Prefecture overlaid with land subsidence contour lines.
Saga Prefecture, located in southwest Japan, is a coastal plain with a population of 880,000. Since 1957, most areas of the plain have been subsiding; the accumulative land subsidence value in the plain is 1.2 meters since 1957, and the total area of subsidence covers 320 square kilometers.

This land subsidence has caused many problems such as the increased risk of flooding, building and irrigation pipe system damage, and pumping facility failure. How to confine the land subsidence has long been a sensitive and serious problem for the prefecture government.

The government of Saga and the research group of Kyushu University of Japan have launched a joint investigation research project using Geographic Information System (GIS) to define the regional land subsidence mechanism and to create a simulation model for determining subsidence confinement countermeasures.

Past field investigations have suggested that the land subsidence is caused by large-scale groundwater pumping. At present, yearly groundwater pumping for the whole plain, mainly for the purpose of agricultural irrigation, is more than 10 million cubic meters.

Klamath Basin Rangeland Trust Builds a Surface Water, Groundwater, and Vegetation Monitoring Network With GIS


click to see enlargement
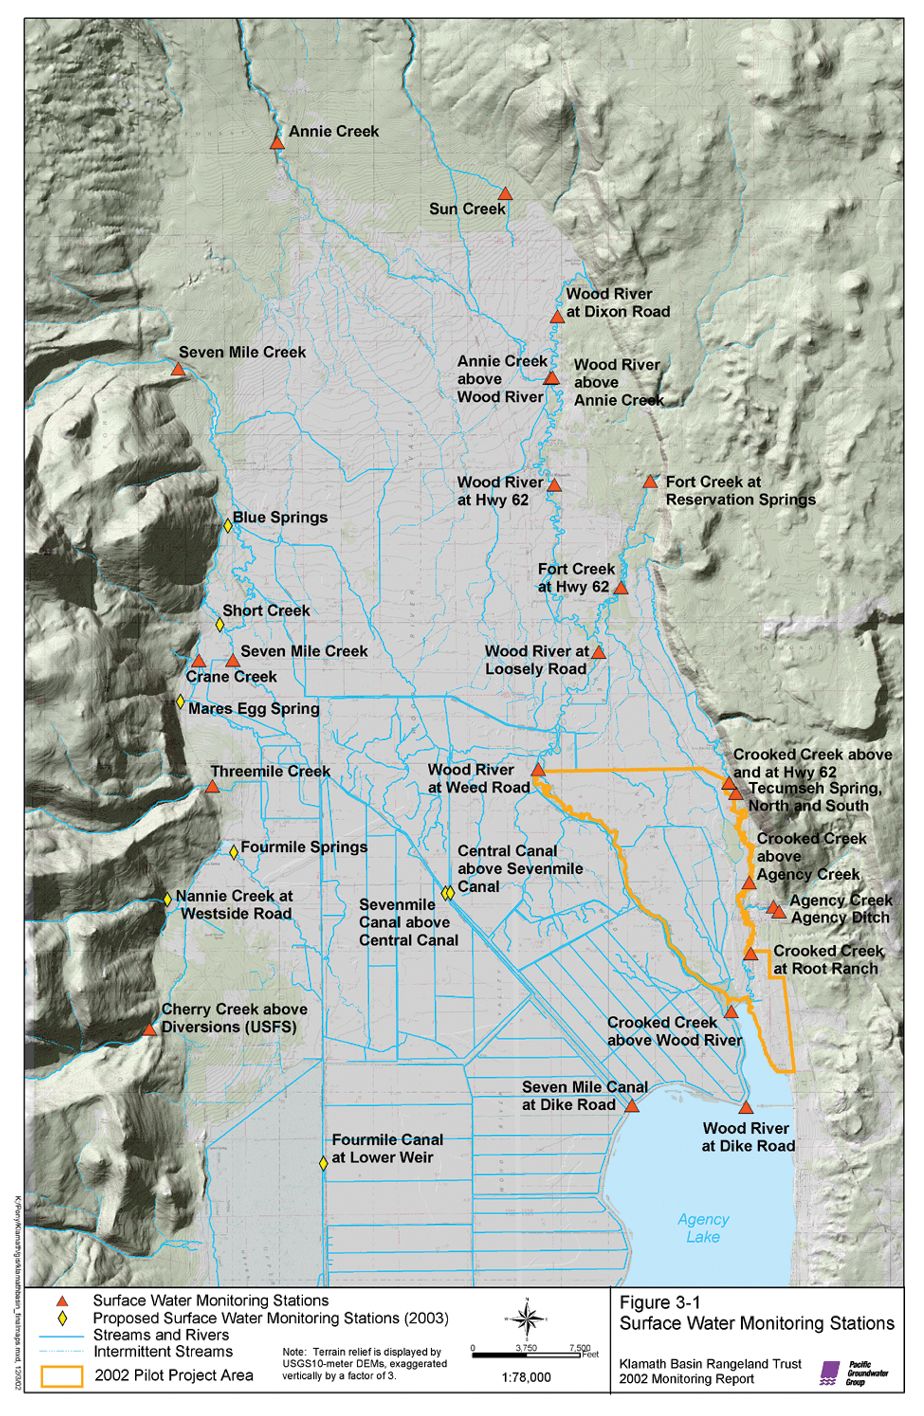
As well as being a valuable tool in the monitoring network design, GIS was heavily used to generate figures that have been used in reports and presentations to a variety of federal agencies, potential private funding sources, and local ranchers.
Large Drainage Basin in Southern Oregon and Northern California (GIS and groundwater).

The Klamath Basin Rangeland Trust (KBRT) was created in response to the current water crisis in the Klamath Basin, a large drainage basin that is located in southern Oregon and northern California in the western United States. The water crisis was widely publicized in the summer of 2001 when the need to supply sufficient water resources to endangered and threatened fish species (including the Klamath River coho salmon, interior redband trout, bull trout, Lost River sucker, and shortnose sucker) resulted in the shutdown of irrigation water to farmers in the Klamath Project Irrigation District and the loss of their crops. The goal of KBRT is to increase the quantity and quality of water available for use by both farmers and fish in the basin by changing land management techniques and conserving irrigation water high in the Upper Klamath Basin.

KBRT has focused its efforts in the Wood River Valley, a small drainage area in the Upper Klamath Basin. The majority of land in the valley is currently used for high-density cattle grazing, which is supported by extensive irrigation and drainage systems that divert water from the spring-fed creeks and rivers onto pastures and that drain the low-lying, wetland areas, allowing cattle to forage. Although this valley makes up only 5 percent of the land area in the upper watershed, almost 25 percent of the water supplied to Upper Klamath Lake originates in this valley due to the high density of artesian springs. KBRT focused on the Wood River Valley because, with such a large amount of water originating from a relatively small area, land use changes by only about 15 ranching operations could significantly augment water supplies to Upper Klamath Lake and other downstream water needs. In 2002, KBRT implemented a new land and water management plan to achieve three goals:

Improving GIS Access to Clean Water in Sub-Saharan Africa

Clean drinking water is hard to find in Mayange, Rwanda (GIS and Groundwater).

That's why a group of university students and two professors from the University of Redlands (U of R) in Redlands, California, traveled to this African region. Using the Geographic Information System (GIS) technology and Global Positioning System (GPS) equipment they brought along, they mapped the area's water sources and collected water use information. Their survey is helping improve access to clean drinking water in the community and in similar communities across sub-Saharan Africa.
click to enlarge
This map shows building density and estimated housing expansion areas in the Mayange sector.

The maps are useful in providing local sustainable development programs with accurate locations of where people get their water. For example, the data can be used to identify areas where water sources are contaminated and support decisions about improving water quality, such as how to protect an open pit water source or where to dig a new water source. Ultimately, this field collection and mapping model may be used for mapping other water networks in Rwanda and other parts of Africa and to contribute to the implementation of sustainable practices in impoverished nations.

"Anything that we can do to improve water quality is going to have a major impact on the population," says Maxwell Baber, Ph.D., associate professor in the Master of Science in Geographic Information Science program at U of R. Baber and Katherine Noble-Goodman, a visiting lecturer in environmental studies at the university, led U of R undergraduate environmental studies students to the rural Mayange sector in 2008 and 2009.

Florida Aquifer Vulnerability Assessment Uses GIS

State Enhances Groundwater and Drinking Water Protection (GIS and groundwater).

Recently developed GIS-based aquifer vulnerability models provide valuable groundwater protection tools with wide-ranging applications throughout Florida. Intended to enhance protection efforts for Florida's fragile drinking water resources, the models provide new options for community planners, public works staff, environmental professionals, storm water and wastewater engineers, and local governments.

These models are extensively used in many areas, including land-use planning, identification of recharge areas, wastewater planning, wellhead protection, identification of environmentally sensitive areas, storm water management, and spring protection.

click to enlarge
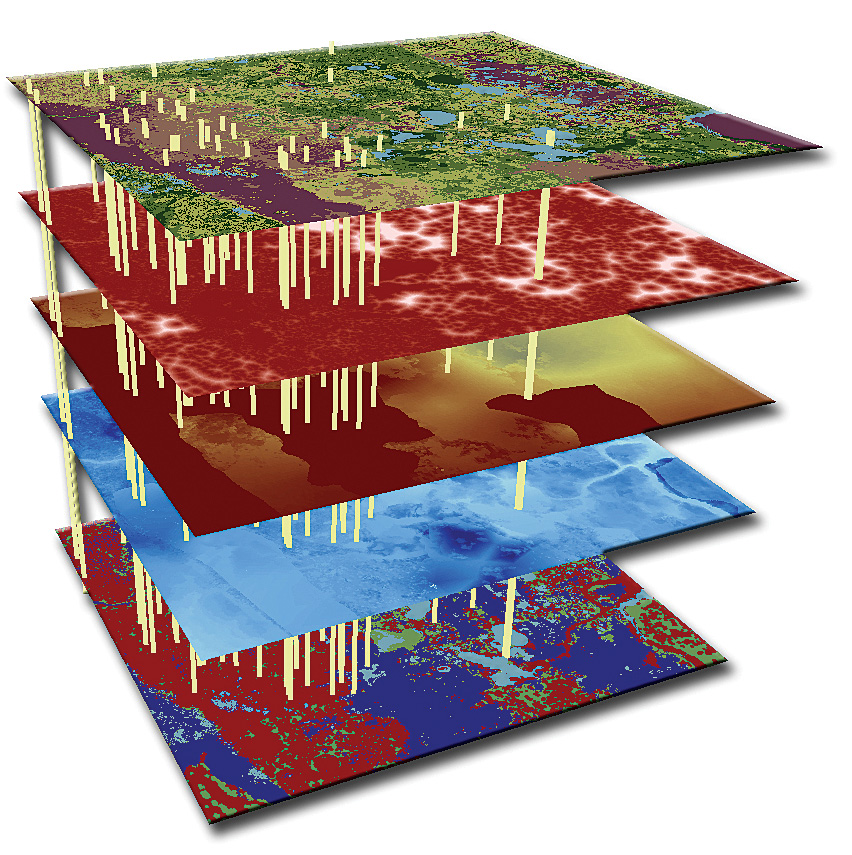
This conceptual model shows the three main components of an aquifer vulnerability assessment: the upper four layers represent soil conductivity; density of sinkhole features, material overlying the aquifer, and estimated aquifer recharge; yellow extruded lines are training points (monitor wells); and the lower layer is the model output, or aquifer vulnerability map.
Aquifers are among the most important sources of drinking water in the United States. In Florida, an estimated 90 percent of drinking water is derived from aquifers, so identifying areas where aquifer systems are more vulnerable to contamination is an essential component of a comprehensive groundwater management and protection program.

The Floridan aquifer system is the most important source of water in Florida, supplying the state with literally billions of gallons of water per day. In addition, the Floridan aquifer system is the source of several hundred freshwater springs, which are valuable resources from a tourism perspective, bringing thousands of visitors to the state per year.

Groundwater protection efforts in Florida are supported by five water management districts, the Florida Department of Community Affairs (FDCA), Florida Department of Environmental Protection (FDEP), Florida Department of Health, and numerous local environmental agencies.

Having a reliable tool that prioritizes areas of higher aquifer vulnerability for both water resource and growth management is a critical requirement for these organizations. Aquifer vulnerability modeling meets this requirement, allowing a proactive approach to the protection of aquifer systems, saving significant time and increasing the value of protection efforts.

Various stakeholders throughout Florida agreed that a new, modern tool was necessary to meet the need to protect groundwater resources. The consensus of many stakeholders was that any tool must take advantage of recent advancements in GIS, be easy to implement, and rely heavily on the state's wealth of geographic and water-resource information that has been carefully collected over the years.

The project that emerged, the Florida Aquifer Vulnerability Assessment (FAVA), was undertaken by the Florida Geological Survey of FDEP. Stakeholders from all of Florida's five water management districts; FDCA; FDEP; Hazlett Kincaid, Inc.; SDII Global Corporation; and the United States Geological Survey (USGS) acted as advisers to the project.

The stakeholder group also peer-reviewed the final model to help strengthen its defensibility, and many of these stakeholders now regularly use FAVA results to complete agency tasks.

The primary goal of the FAVA project was to provide a scientifically defensible water resource management and protection tool that facilitated land-use planning to help minimize impacts on groundwater quality. The project's designers sought to generate meaningful and useful tools to help ensure balanced protection and future use of groundwater resources by characterizing the natural vulnerability of aquifer systems.

ArcGIS Desktop was selected as the development platform for the FAVA project because of the state's existing investment in the software suite. After careful assessment of available modeling techniques that would best suit an aquifer vulnerability analysis, the Arc Spatial Data Modeler, or Arc-SDM, was also selected.

Arc-SDM was programmed by Don Sawatzky under the direction of Dr. Gary Raines of USGS and Dr. Graeme Bonham-Carter of the Geological Survey of Canada. Arc-SDM requires ArcGIS Spatial Analyst and is currently available on ESRI's ArcScripts Web page: arcscripts.esri.com/details.asp?dbid=15341. Analytic techniques of Arc-SDM are being evaluated for inclusion in future versions of ArcGIS Spatial Analyst.

Arc-SDM consists of geoprocessing tools used to generate predictive maps describing probabilities of occurrences of specific events in a study area. The preferred Arc-SDM modeling component selected for the FAVA project was Weights of Evidence; this method is data driven and involves the combination of diverse spatial data to describe and analyze interactions and generate predictive models.


click to enlarge
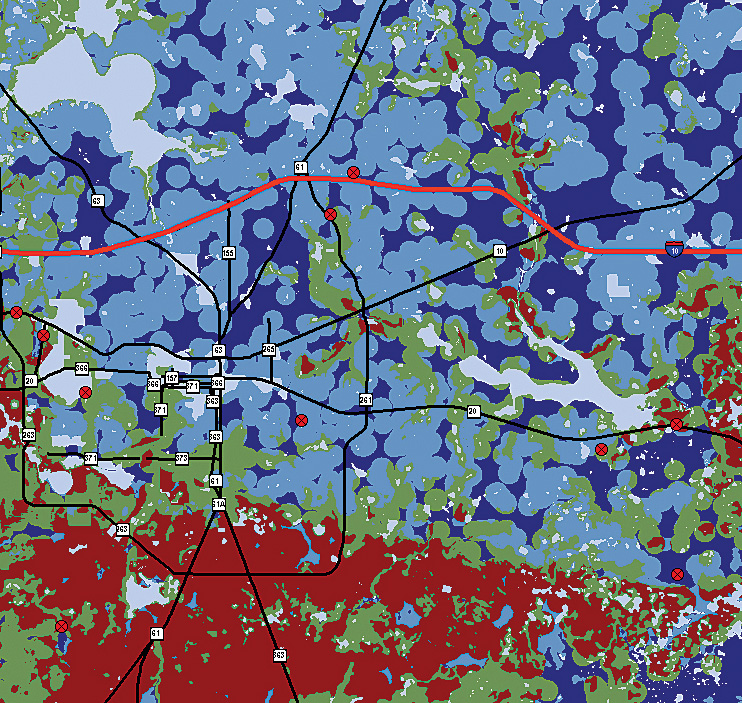
Training points are necessary for the Weights of Evidence analysis in Arc-SDM (shown here in red) and are used as indicators of aquifer vulnerability.
Critical to the success and defensibility of the FAVA project were reliable, consistent datasets. The initial phase of the FAVA project comprised acquisition, development, and attribution of various GIS datasets representing natural hydrogeologic conditions.

This input data included digital elevation, aquifer recharge, subsurface material properties, sinkholes/karst features, soil properties, and water quality. The latter was developed to train the FAVA model, as Weights of Evidence requires a training point dataset, and water quality can be indicative of vulnerability in an aquifer system.

For example, naturally occurring oxygen and nitrogen are generally considered ubiquitous at land surface; further, relatively low concentrations of these analytes occur in well-protected aquifer systems. Where these analytes occur above natural background concentrations in aquifers, one can assume a good interaction between land surface and the aquifer; in other words, vulnerability is higher.

Development of input datasets required heavy use of ArcGIS Desktop extensions, including ArcGIS Geostatistical Analyst, used with borehole point data to generate models of subsurface materials; ArcGIS Spatial Analyst, used to process digital elevation data, extract suspected sinkhole features, and execute the model; and ArcGIS 3D Analyst, used to conceptualize input data layers and generate slides and figures.

The modeling phase of the FAVA project relied on use of Weights of Evidence to generate aquifer vulnerability response themes, which are expressed as probability maps. Probability values of these maps are classified into groups and assigned intuitive names reflecting relative aquifer vulnerability and thus become meaningful to the end user.

These final maps are based on the spatial relationships between the input data and the training points—or points of known vulnerability—and express the likelihood that an area is more or less vulnerable. Maps were generated for all three of Florida's major aquifer systems: the Floridan, intermediate, and surficial aquifer systems.

Following completion of the project and release of model results, three members of the FAVA research team from the Florida Geological Survey formed Advanced GeoSpatial Inc. to meet the growing demand for more aquifer vulnerability modeling projects, specifically for the Floridan aquifer system, the state's most heavily used water resource.

Several local projects were initiated along with an ongoing second phase of the FAVA project intended to improve results of the first project. Currently, six Florida counties—Alachua, Citrus, Leon, Levy, Marion, and Wakulla—have aquifer vulnerability assessments in use in various groundwater protection efforts.
photo of a Floridian aquifer system
The Floridan aquifer system is the most important freshwater resource in Florida and is also the source of several hundred freshwater springs. Cypress Spring in northwest Florida is a pristine example of these unique natural features. (Photo credit: Kevin Defosset of the Northwest Florida Water Management District, 2003.)

Implications and use of aquifer vulnerability models are widespread and include development of wastewater guidelines, spring protection mapping, establishment of best management practices, and design of nitrate loading models.

Local agencies have extensively applied the results of local scale analyses. For example, the Marion County aquifer vulnerability model is used to prioritize watershed management projects in sensitive areas.

The Leon County aquifer vulnerability model is used to augment extension of sanitary sewer service and to protect Wakulla Spring, located south of the county.

The Alachua County model was adapted into an aquifer-protection zone map complete with other natural features like springshed areas and sinking streams.
Source: ArcNews, ESRI


More Information 
For more information about FAVA and related projects and to access project data, visit www.dep.state.fl.us/geology/programs/hydrogeology/fava.htm or contact Alex Wood, president of Advanced GeoSpatial Inc. (tel.: 480-699-7800, e-mail: awood@adgeo.net); Dr. Jonathan Arthur, Florida Department of Environmental Protection (tel.: 850-488-9380, e-mail: jonathan.arthur@dep.state.fl.us); or Dr. Gary Raines of the United States Geological Survey (retired) (tel.: 775-323-4074, e-mail: garyraines@earthlink.net).

Assessment of groundwater contamination using geographic information systems (Seoul, Korea)

Two sites were selected in order to investigate groundwater contamination and spatial relationships among groundwater quality, topography, geology, landuse and pollution sources.(GIS) One site is the Asan area, an agricultural district where pollution sources are scattered and which is mainly underlain by granite of Cretaceous age. The other site is the Gurogu area of Seoul city, an industrial district where an industrial complex and residential areas are located and which is mainly underlain by gneiss of Precambrian age.

Groundwater samples collected from these districts were analysed for chemical constituents. An attribute value files of chemical constituents of groundwater and the spatial data layers were constructed and pollution properties were investigated to establish out spatial relationships between the groundwater constituents and pollution sources using geographic information systems (GIS).

Florida Keys Canal Project Tackles Water Quality Degradation With GIS


click to see enlargement
The Florida Keys island chain.
(GIS) Hundreds of thousands of people flock each year to the Florida Keys for world-class fishing, diving, and the breathtaking scenery. The Keys stretch 110 miles from Key Largo to Key West and are home to about 80,000 people. Because residents desire homes adjacent to the water with dock space for boats, finger canals have become an essential characteristic of Keys life. Today there are 481 canals, totaling 111 miles, in Monroe County (groundwater).

Monroe County officials are concerned about water quality degradation in the canals. According to George Garrett, director of the Monroe County Marine Resources Department, there are currently about two dozen county canals with no access to open water—they remain plugged due to changes in environmental regulations imposed in the 1970s.

Residents have also long reported a problem with flotsam entering open canals with the accumulating seaweed decaying and fouling the waterway.


Challenge

seaweed in a canal
Seaweed and flotsam buildup in a Florida Keys canal.
To date, there has been no systematic monitoring of canal water quality in the Florida Keys. To evaluate what type of remedial actions may be necessary for the canals, ESRI Business Partner MACTEC Engineering and Consulting, Inc., was awarded a contract to undertake a survey of canal conditions throughout the Keys.

The goal of this project was to bring as much information as possible into a single GIS on the physical characteristics, potential pollution sources, and existing water quality of each of the canals.

MACTEC utilized ArcView to not only compile, process, and relate the existing data but also to generate extensive attribute data for the residential canals. With the canal inventory complete, ArcView software's spatial querying capabilities proved to be key throughout the assessment and analyses process.
Canal Inventory and Data Development

MACTEC spatially located the residential canals through a process that began with digitizing all water bodies from the 1998 aerial photographs of the Florida Keys, obtained from Florida Department of Transportation District 6 and available as part of the Florida Geographic Data Library 1:24,000 black and white aerial photography.

The aerial images were selected because of their relatively high resolution and extensive coverage of the study area. After digitizing the water bodies, MACTEC performed quality control through select field verifications, interviews with local home owner associations, and distribution of the water body layer to local agencies for comments. During this task, the layer was refined to include only the residential canals located within the Florida Keys, which were the focus of the study.
click to see enlargement
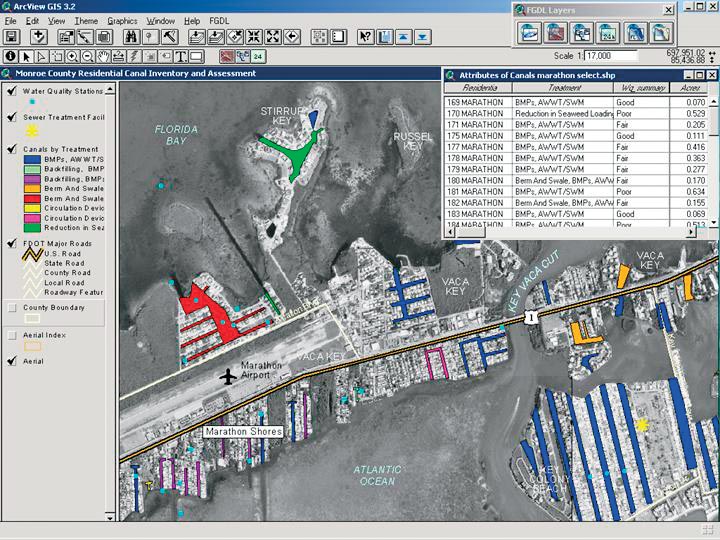
Residential canals color-coded by recommended canal treatments.
After the polygon layer representing the residential canals was created and verified, ArcView was used to populate the attribute table with physical characteristics that could potentially impact water quality in the canals.

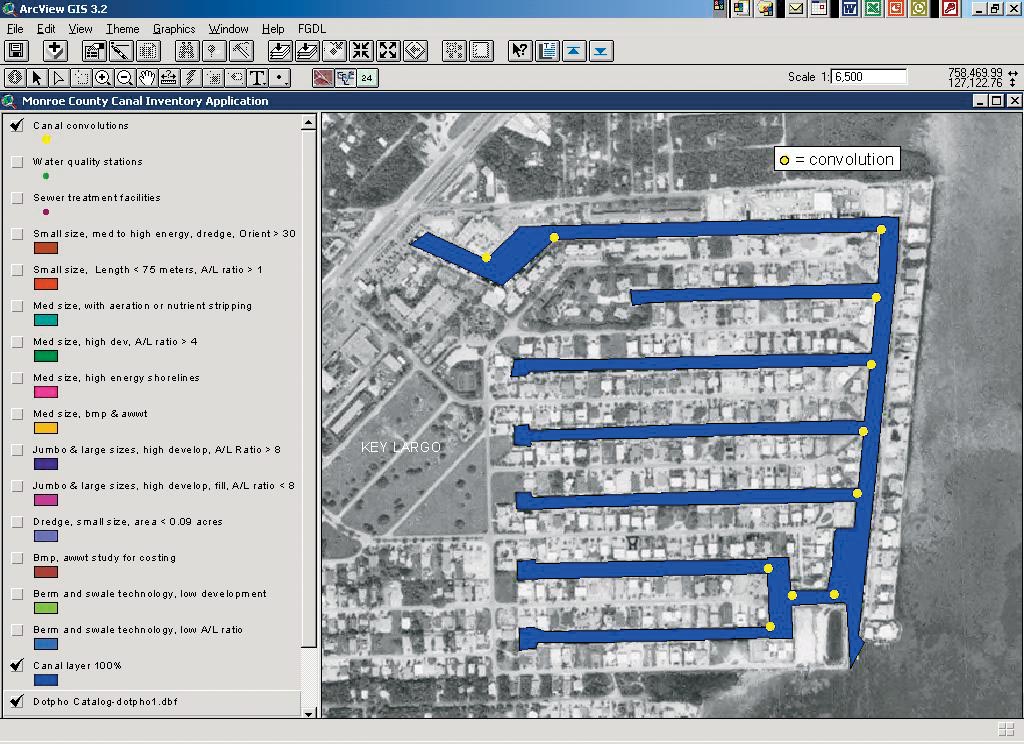
These attributes included canal area, width, length, number of mouths, degree of convolution, and latitude and longitude of the centroids of the canals. The number of convolutions was determined by measuring the number of 90-degree turns, or fractions of 90-degree turns, in the canal.

The existing data that had been gathered, inventoried, and evaluated during an extensive data compilation effort was processed and input to the project GIS and related to the residential canals. Information varied from topography and land use information to water quality data dating back 40 years.

The water quality data was particularly challenging to incorporate, as historically it had been developed on a project by project basis that included only small sections of the Keys. Many of the source data sets lacked a complete metadata record of the methodologies and instrumentation used.

Although the historical water quality data was of value to see general trends in parameter variability, it was impossible to compare many data sets that were collected using different (or undocumented) methods. The data quality control review included a review of methodologies and documentation. Only data with comparable methods and documented protocols could be confidently compared between different monitoring stations over time. A separate GIS layer was provided as a point file of existing water quality monitoring station locations and linked to the sampling data.

Canal Assessment and Analyses

With the residential canal inventory complete and the GIS data set developed, ArcView software's spatial querying and analyses capabilities were used throughout the canal assessment process.
click to see enlargement
The 11 convolutions in the Port Largo Canal system.
MACTEC collected sufficient information, through GIS analysis of physical attributes, to evaluate potential impacts to water quality without the cost of a large-scale field sampling effort. For example, the number of convolutions and the length of a canal were used to estimate a canal's ease of circulation with adjacent nearshore waters. 

A classification model for the canals was created with canals queried and grouped by common physical characteristics. MACTEC developed a method to determine estimated water quality for each canal based on its classification, and the soundness of the developed methodology was verified by comparing the estimated water quality with the actual water quality where data was available. The values agreed, and water quality could then be estimated for all canal systems without a large-scale field effort.

GIS was also used to develop a strategy for selecting the canal specific treatment approaches and technologies that would improve water quality. ArcView was again used to query the physical attributes, which were the major factor in determining the most applicable and cost-effective options. The process also presented a methodology for prioritizing canals based on available funding or immediate interest of local residents to "do something" to improve canal water quality.

As a final step, ArcView was used to identify data gaps and recommend the type of canals Monroe County should sample if it decides to conduct a field sampling effort.
The Bottom Line

Management of residential canal water quality will become increasingly important to Monroe County as build-out of the Florida Keys continues. A comprehensive and systematic approach to canal mitigation will be necessary to prevent long-term impact on adjacent marine resources.


click to see enlargement
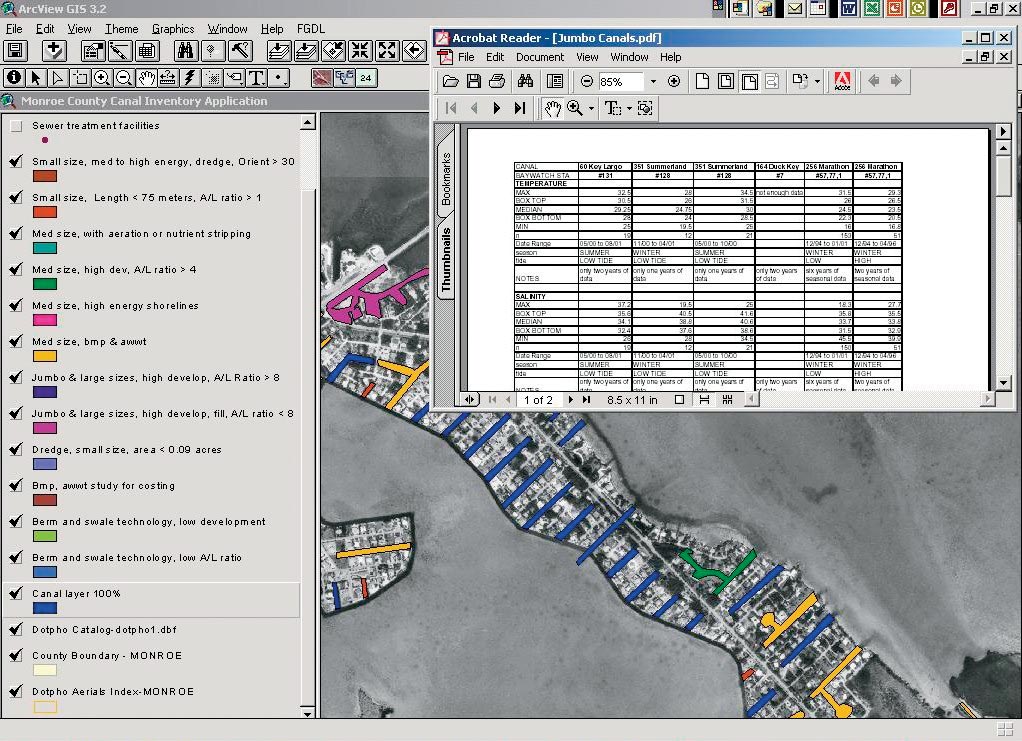
A water quality parameter data report is linked to each canal.
"This report will give us the necessary tools to fully understand the situation and come up with cost-effective solutions," Garrett says. "We anticipate implementing many of these technologies in the near future because different solutions will be required for different areas throughout the canal system. Now that we have a full understanding of the situation, we can also launch a public outreach program so canal residents can be educated."

ArcView has helped Monroe County establish a methodology for grouping canals by design features most likely to impact water quality, thus providing a method for assessment of treatment technologies for individual canal systems. (Source: ArcNews, ESRI)


By Wendy Leonard, Project Manager, and Karen Zahalka, GIS Manager, MACTEC Engineering and Consulting, Inc.
For more information, contact George Garrett, director of the Marine Resources Department, Monroe County (tel.: 305-289-2507, e-mail: garrett-george@monroecounty-fl.com); Wendy Leonard, project manager, MACTEC, Inc. (tel.: 305-826-5588, e-mail: wcleonard@MACTEC.com); or Karen Zahalka, GIS manager, MACTEC, Inc. (tel.: 770-421-3447, e-mail: kazahalka@MACTEC.com).

Urbanization and its impact on groundwater: a remote sensing and GIS-based assessment approach

A GIS integrated approach has been used to assess the impact of urbanization on groundwater resources of the Ajmer city, India. Urban growth has been estimated using remote sensing imageries and subsequent use of (from year 1989 to 2005) digital image processing techniques, like image extraction, rectification, restoration, and classification.

Groundwater recharge has been estimated using a simple water balance approach known as Water Level Fluctuation Methodology, which is directly implemented in GIS on a cell basis. Further, impact of urbanization on groundwater resources (recharge and quality) have been studied using overlay analysis of interrelated themes in GIS.

The present study is useful in identifying the potential threats to groundwater of area, and to generate a water resource database for overall development on a sustainable basis, which can help urban planners and decision makes for the policy decisions.

Groundwater vulnerability and risk mapping in a geologically complex area by using stable isotopes, remote sensing and GIS techniques

(GIS) The Paluxy aquifer in north-central Texas is composed primarily of Lower Cretaceous clastics. This aquifer provides water for both domestic and agricultural purposes in the region. The study area for this investigation incorporates the outcrop and recharge areas, as well as the confined and unconfined portions of the aquifer. The purpose of this investigation is to perform a groundwater vulnerability assessment on the Paluxy aquifer using the GRASS 4.1 geographic information system (GIS) combined with a modified DRASTIC approach.

DRASTIC is an acronym for the variables that control the groundwater pollution potential (Depth to water, net Recharge, Aquifer media, Soil media, Topography, Impact of the vadose zone, and Conductivity of the aquifer). Using such an approach allows one to investigate the potential for groundwater contamination on a regional, rather than site-specific, scale.

Based upon data from variables such as soil permeability, depth to water, aquifer hydraulic conductivity, and topography, subjective numerical weightings have been assigned according to the variable's relative importance in regional groundwater quality. The weights for each variable comprise a GIS map layer. These map layers are combined to formulate the final groundwater pollution potential map.

Using this method of investigation, the pollution potential map for the study area classifies 47% of the area as having low pollution potential, 26% as having moderate pollution potential, 22% as having high pollution potential, and 5% as having very high pollution potential (Fig. 1).


Figure 1. Generalized pollution potential map of the Paluxy aquifer, north-central Texas.


Original article:
An Aquifer Vulnerability Assessment of the Paluxy Aquifer, Central Texas, USA, Using GIS and a Modified DRASTIC Approach
Todd G. Fritch, Cleavy L. McKnight, Joe C. Yelderman Jr. and Jeff G. Arnold
Environmental Management, Volume 25, Number 3 / March, 2000

Regulating Illegal Piggery Waste Runoff

GPS/GIS in American Samoa, South Pacific.


A surveyor and an educator are inspecting a piggery and educating the piggery owner.
The raising of pigs in American Samoa represents an important part of the Samoan culture. Pigs are consumed during a variety of social events, from birthdays to funerals and from weddings to farewell parties (groundwater).

However, pigpen (piggery) waste disposal has been largely uncontrolled, resulting in volumes of untreated pig urine and feces contaminating drinking water, streams, and nearshore ocean water. The impacts of pig waste on human health and water quality are now critical, and illness and death due to pig-related disease are documented.

In April 2006, the American Samoa Environmental Protection Agency (ASEPA), in an attempt to regulate this nonpoint source pollution, launched the Piggery Compliance Program. The purpose of this program is to inventory all existing piggeries, educate piggery owners on safe practices for the raising of pigs, and enforce the current regulations. The goal of the program is to legalize those piggeries that are compliant with current regulations and to relocate or remove all noncompliant piggeries that represent a threat to human and environmental health.
In a country where physical addresses do not exist, GPS and GIS technologies were essential for the success of this program. The exact location of each piggery was acquired using GPS units, while information regarding each piggery was easily stored, edited, and retrieved using GIS technology.

American Samoa is a U.S. territory located in the South Pacific between Hawaii and New Zealand. It is made up of five islands and two atolls with a population of 60,000 people, most of whom live along the coast of the main island, Tutuila (approximately 130 square kilometers). American Samoa's lifestyle was based on traditional customs and a subsistence economy until the 1960s, when President Kennedy made funds available to modernize the territory and jolted its people into 20th century life. The population has tripled since then, and a new issue has arisen: stream water once used for household chores is now contaminated by fecal bacteria.
click to enlarge
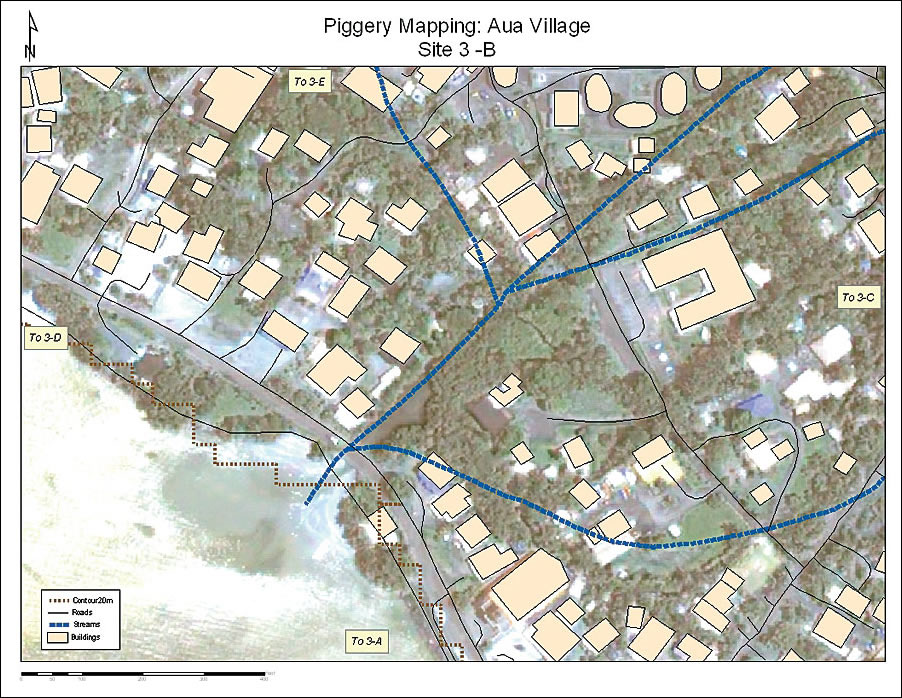
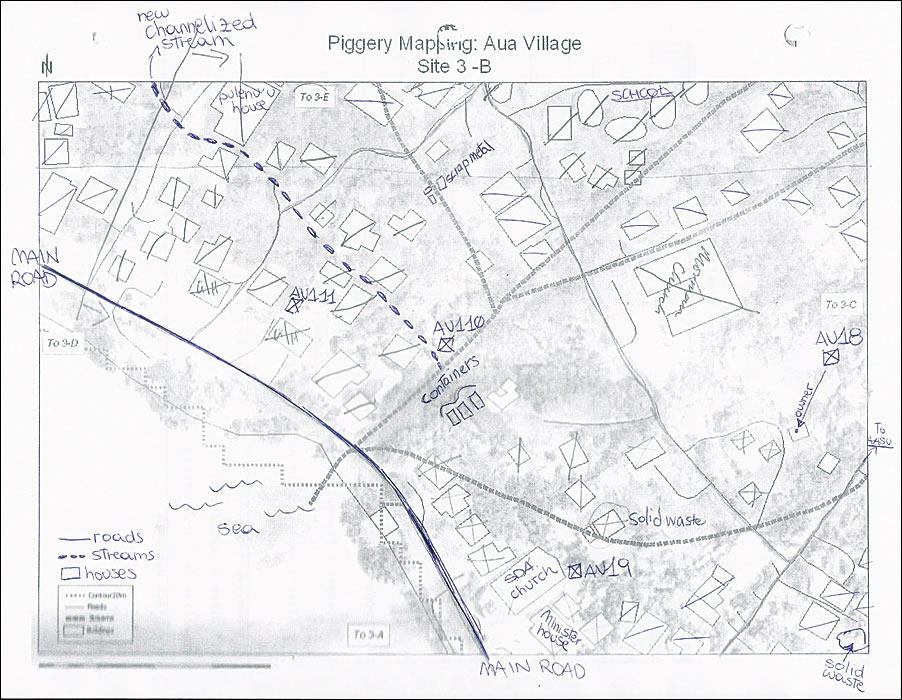
This is an example of the maps that were given to the surveyors before fieldwork.
click to enlarge
The same map after fieldwork. The surveyor wrote notes on piggery and solid waste locations, as well as indicated major buildings (such as churches) and the location of the piggery owner's house.


In April 2006, ASEPA personnel and volunteers from other agencies (a total of about 30 persons) were trained to use the three Trimble XP GPS units available. They visited each house and road of the territory, recording piggery and solid waste locations, educating piggery owners, and collecting piggery and owner information.

ArcView was used in the two different phases of the piggery compliance program: phase 1, inventory and education, and phase 2, enforcement.

Before the fieldwork, the teams were given paper maps of the area to survey, where they wrote notes on piggeries and solid waste locations and checked the visited houses one by one. This step was very important in case of GPS failure or misuse. QuickBird satellite images were also used to identify structures that did not appear in the available GIS shapefiles.

Pathfinder Office software was used to create a data dictionary to assure the systematic and correct collection of the data for each piggery. It was also used at the end of each working day to download, differentially correct, and export the data into a personal geodatabase. Data was collected using TerraSync software. Editing to correct wrong locations (the point was taken at a distance from the piggery) and spelling mistakes was also done on a nearly daily basis.

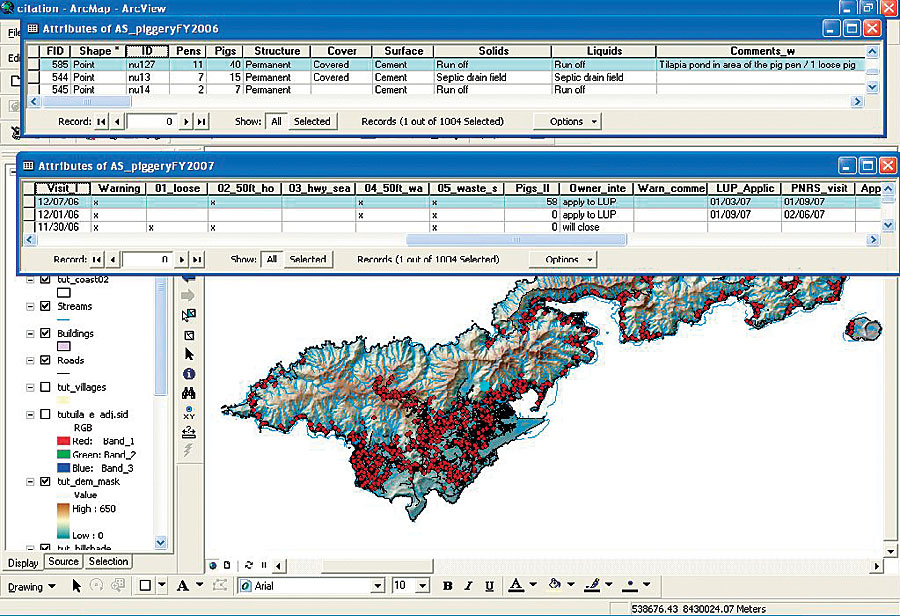
ASEPA surveys found approximately 8,300 pigs contained in 1,005 piggeries, of which only 3 percent were compliant with current regulations. After the inventory/education phase, spatial analysis was used to identify those piggeries that represented a major threat to human health, focusing on those located within 50 feet of streams in highly populated villages. The database was also enlarged to contain information regarding enforcement action for each piggery.

The geodatabase is essential for a rapid retrieval of data, and it is used to identify and relocate piggeries after complaints and to track warnings, citations, relocation, and removal of piggeries during the enforcement phase of the program (phase 2).
click to enlarge
The attribute table is used to identify piggeries.


The GPS/GIS approach to this project proved to be time efficient and cost-effective. Frequent and uncomplicated training of personnel by ASEPA GIS specialists allows having two to three teams always ready for fieldwork, and the easy interface of ArcView allows enforcement officials to access the database and retrieve information even without a deep understanding of GIS principles.

This same approach is now being applied to the enforcement of illegal solid waste in American Samoa, and because of its straightforwardness and cost-effectiveness, it is recommended to other Pacific islands and small communities that want to locate and eradicate sources of pollution in a limited time frame and with limited financial resources. (Source: ArcNews, ESRI)

By Barbara Zennaro, Environmental Scientist, American Samoa Environmental Protection Agency

For more information, contact Barbara Zennaro (e-mail: zennarob@gmail.com).

GIS for identification of suitable areas for artificial recharge (Meimeh Basin, Isfahan, Iran)

Flood spreading is an inexpensive method for flood mitigation and artificial recharge of aquifers that results in a large budget return for relatively small investment.

It is necessary to study some regional characteristics in order to determine the appropriate areas for artificial groundwater recharge by flood spreading in Meimeh Basin, Isfahan Province, Iran. Necessary regional characteristics to be studied are: slope, infiltration rate, sediment thickness, transmissivity, and water quality. In this research to identify suitable areas for artificial recharge several thematic layers were prepared, assigning each layer to one of the mentioned characteristics.

The thematic layers were classified to several classes based on the existing criteria. All of the classes of the thematic layers were integrated and analyzed using a decision support system (DSS) in a geographical information system (GIS) environment. Figure 1 shows a part of the decision trees of the system.


 Fig. 1 A part of decision tree


Finally suitability of the integrated classes for artificial recharge was identified in which the following classes were separated: (i) Very suitable, (ii) suitable, (iii) moderate suitability, and (iv) unsuitable (Fig. 2).

Fig. 2 Suitability of the study area for artificial recharge


The validity of the generated model was verified by applying the model to a number of successful floodwater spreading stations throughout Iran. The verified model showed satisfactory results for all of the stations. The results for Meimeh Basin showed that about 70% of the Quaternary sediments in the studied area are suitable and moderately suitable for artificial recharge by flood spreading.


Original Article:
Integrating GIS and DSS for identification of suitable areas for artificial recharge, case study Meimeh Basin, Isfahan, Iran
Jafar Ghayoumian, B. Ghermezcheshme, S. Feiznia and A. A. Noroozi
Environmental Geology, Volume 47, Number 4 / March, 2005

Dye Study on the Mississippi River

The City of Rock Island Models a Combined Sewer Overflow/Outfall Mixing Zone with GIS.


click to enlarge
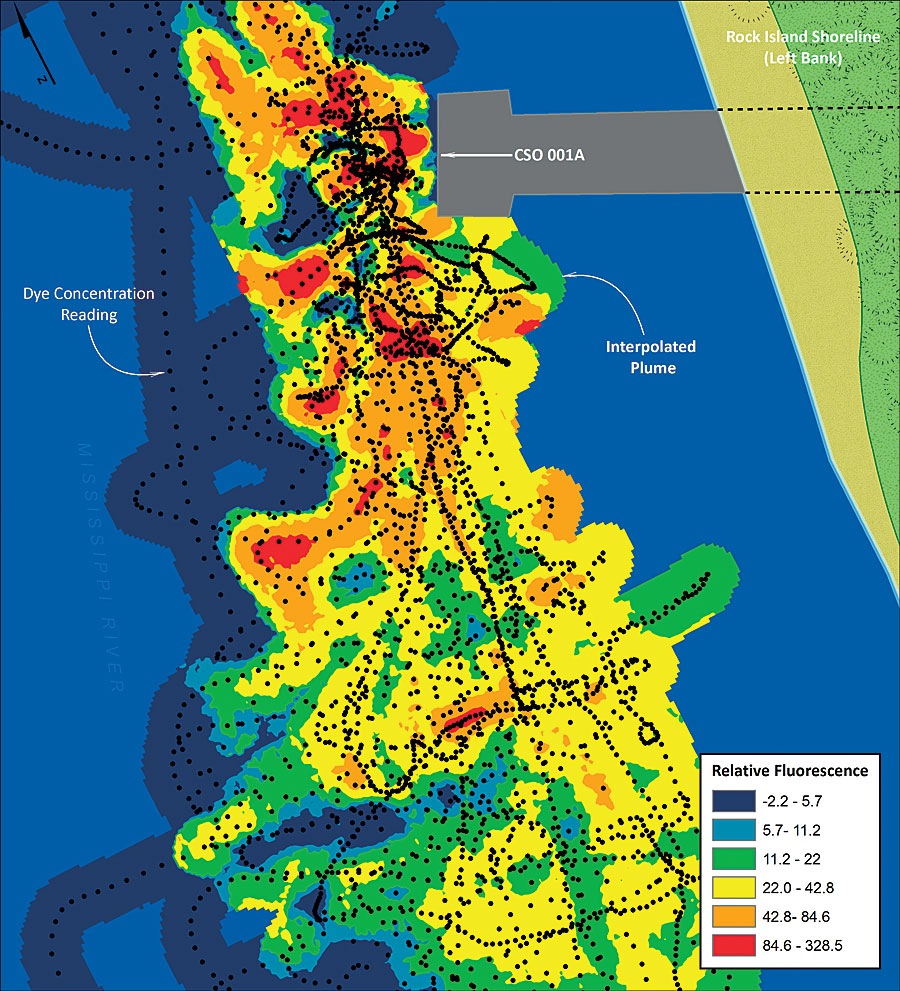
Dye study outfall mixing results illustrated by levels of relative fluorescence present using GIS.
Rock Island is located in the southwest corner of the Quad Cities area in western Illinois on the Mississippi River, 165 miles west of Chicago, midway between Minneapolis, Minnesota, and St. Louis, Missouri. Rock Island is bounded by two large rivers, the Mississippi River to the north and west and the Rock River to the south. These rivers support many leisure activities in the area and have beautiful scenic views.

Rock Island, like many other older cities in the United States, has a combined sewer system (CSS). CSSs are wastewater collection systems designed to carry sanitary sewage and storm water in a single pipe to a treatment facility.

During dry weather, CSSs convey sanitary wastewater. In periods of rainfall or snowmelt, total wastewater (sanitary and storm water) flow can exceed the capacity of the treatment facilities. When this occurs, the CSS is designed to overflow directly to surface water bodies to prevent sewage backup in the streets and/or into homeowner basements. These overflows—called combined sewer overflows (CSOs)—can be a major source of water pollution in communities served by CSSs.

Purpose

The United States Environmental Protection Agency (USEPA) brought suit against the City of Rock Island, Illinois, in August 2000 for alleged violations of the Clean Water Act. USEPA alleged that frequent CSOs caused degradation of the city's receiving water.

Symbiont, a full-service engineering and consulting firm headquartered in West Allis, Wisconsin, was retained by the city to perform a water quality modeling study. The purpose of this study was to determine the compliance of the receiving water with state water quality standards (and designated uses), assess CSO impacts to the rivers, and evaluate appropriate CSO control alternatives to be implemented as part of the city's Long Term Control Plan (LTCP). Symbiont (formerly Triad Engineering Incorporated) was selected because of its diverse capabilities and its innovative approach demonstrated in other water resource-related projects.

As part of the overall project, a dye study was planned using GIS and GPS at one of the city's CSO outfalls to characterize CSO discharges and to evaluate plume mixing and dispersion under select river flow conditions.

Since the late 1990s, Rock Island's wastewater utility has been using ArcView to manage CSS features in its GIS. However, in 2001, a major effort was initiated by the City of Rock Island and Symbiont to begin remapping and inspecting the majority of the manhole features to comply with LTCP objectives. Using ArcView, a rugged Tablet PC, and a real-time kinematic (RTK) GPS rover, field crews populated structure attributes in their GIS in real time while having instant access to additional datasets and basemap layers. Subsequent to the up-front investment costs, the City of Rock Island realized significant savings with respect to labor costs, as well as increased data integrity and accessibility using the portable ArcView system.

Prior to performing the CSS inspections, the City of Rock Island had installed an RTK GPS base station on top of one of the local water towers, and using its GPS rover, the city was capable of obtaining subcentimeter horizontal accuracy for each of the collection points. The rover was capable of picking up signals from the base station more than seven miles away. Using the ArcView Buffer proximity tool, Symbiont determined the city could easily use the same GPS/GIS integration technology while performing the dye study, without having to reestablish a temporary base station or consider more traditional methods.

Methodology

Two CSO events were planned on the Mississippi River—a low-flow CSO event and a high-flow CSO event. The CSO outfall selected to perform the dye study is located 35 feet offshore in an area of the Mississippi River that is nearly 1,000 feet across. The magnitude of the Mississippi River flow compared to any discharge from Rock Island suggests water quality impacts, if present, would be localized. Overlaying land-use layers in GIS was useful in illustrating downstream recreational river frontage, including a park and marina, and for this reason, a dye study was conducted to evaluate discharge plume mixing in the river.
performing a dye study
Performing dye study on the Mississippi River with GIS.
A fluorescent dye, Rhodamine WT, was utilized to determine how quickly a wastewater stream mixes with Mississippi River water. The tracer mimics the behavior of the discharged wastewater. The Rhodamine WT tracer was chosen because it was cost-effective and was easily and accurately measured on-site with a portable, field-ready fluorometer.

With known underwater hazards and unpredictable currents, performing fieldwork on a boat was required. Measurement of effluent discharge from the outfall was gauged using a tracer dilution method. Symbiont senior hydrogeologist Tina Reese determined that a constant-rate injection method, where dye is injected continuously until in-stream concentrations plateau and reach equilibrium, would best model an actual discharge. In order to accurately model the entire plume, thousands of dye concentration data points were required in both the horizontal and vertical directions at locations in the vicinity of and downstream from the CSO.

A Self-Contained Underwater Fluorescence Apparatus (SCUFA) was used to log dye concentration readings every second, which provided real-time fluorescence readings. Existing dye study literature focused on small streams or rivers where data collection could easily be performed using traditional survey methods. However, to clearly depict the dye plume in the Mississippi River, many readings were required, potentially thousands. Symbiont GIS manager Ryan Eckdale-Dudley knew that GIS integration was the solution to collecting and analyzing the dye study data.

"Utilizing GPS for real-time data collection and GIS for data analysis and presentation was a perfect solution to a complex problem," Eckdale-Dudley says. He suggested integrating an RTK GPS with the SCUFA so that every second the SCUFA was collecting a dye concentration, a GPS unit would record its location consistent with the city's existing GIS. Once the data was collected, ArcView and ArcGIS Spatial Analyst could be used to identify mixing zones downstream from the outfall, and discrete data points could be converted to a raster for illustration and additional analysis.

Using the city's boat, Symbiont mounted a GPS antenna directly above the SCUFA unit. During normal discharge conditions, a metering pump was used to inject the dye at a constant rate upgradient of the outfall structure in a nearby manhole. Once equilibrium of the dye was reached, field crews navigated the boat upriver to the study area from the nearby marina. In the boat, the field crew traversed the plume, taking GPS and dye concentration readings every second until the entire plume was surveyed multiple times at various depths to evaluate horizontal and vertical mixing. Having the GPS unit connected to ArcView while performing the study provided a map of real-time sample locations, which made it possible to verify the team collected sufficient data for the entire study area. In a little over an hour, more than 4,000 data points had been recorded.

Back onshore, the datasets were combined in ArcView using the time stamp collected by each piece of equipment. With so much data in such close proximity, it was difficult to interpret the raw point data alone. Prior to the dye study, Symbiont had been leveraging the ArcGIS Spatial Analyst extension to evaluate other environmental datasets with great success. Using ArcView and ArcGIS Spatial Analyst, dye concentration data points were interpolated to raster surfaces using kriging as the statistical method. Once complete, data classification and symbology of the raster made it possible to easily visualize and perform additional analysis of the plume dispersion. Using surface analysis tools in Spatial Analyst, contours were easily created to accurately illustrate the zones of dilution. The ArcGIS 3D Analyst extension was utilized to generate triangulated irregular network (TIN) surfaces, making it possible to create cross-sectional plume profile graphs using ArcGIS 3D Analyst.

Results

Based on the results of the dye study, the city was able to document that wastewater discharged to the receiving stream during a CSO event was dispersed and well mixed within 150 feet downstream from the outfall and that the maximum plume width was less than 50 feet from the outfall structure. It was also noted that the main navigational channel acted as a barrier to plume migration to the opposite bank, thus making the plume unable to impact water quality on the Iowa side of the river. These results helped determined long-term CSO control alternatives for the city's planning strategies.(Source: ArcNews, ESRI)

More Information
For more information, contact Dale Howard, utilities superintendent, City of Rock Island (e-mail: Howard.Dale@rigov.org); Ryan Eckdale-Dudley, GIS manager, Symbiont (e-mail: ryan.dudley@symbiontonline.com); or Tina Reese, senior hydrogeologist, Symbiont (e-mail: tina.reese@symbiontonline.com).

Reducing Pollution on the Black Sea Coast

click to enlarge
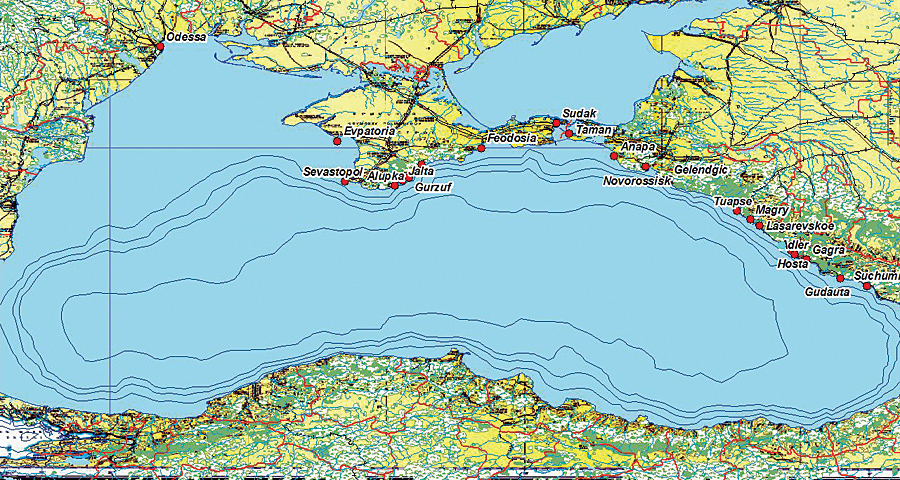
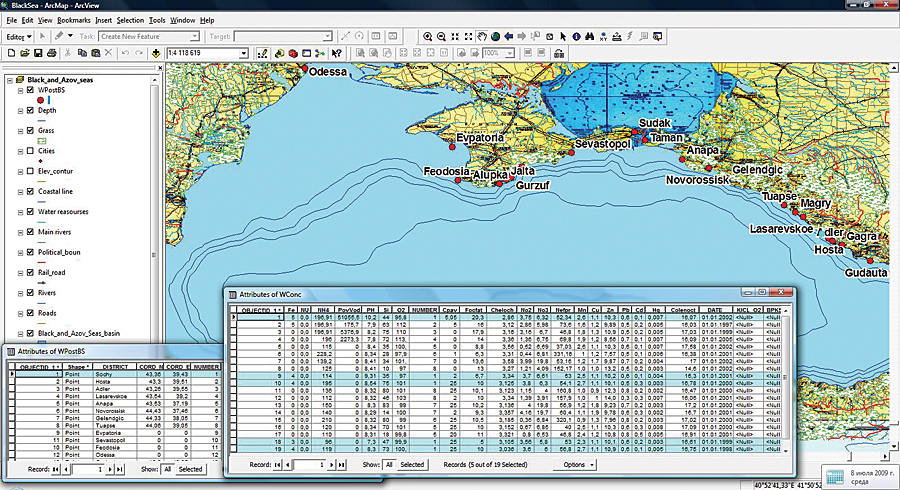
Map of the Black and Azov seas, which is structured as separate layers: cities, rivers, seas, forests, roads, borders, railways, etc.
Marine pollution has been a concern for a long time, but during the last decade, the issue has become more pressing as human influences have exacerbated the problem and vast ecosystems have been affected. It is no longer a local or regional matter; it is a major international problem that must be addressed with a systematic approach.

A Vast Ecosystem in Danger

Seas inside and surrounding Russia have intensive anthropogenic loading, both in water bodies and as a result of industrial activities near catchment basins. The main sources of pollution are river drainage, sewage, and water transportation. Pollution in the Black Sea is particularly worrisome, especially as Russia prepares to hold the 2014 Winter Olympics in Sochi. There are dire ecological consequences to deal with because of chemical, physical, and biological pollution; the change of the hydrological balance of the Black and the Azov seas; and man-made stressors on the seas.


The Black Sea's deep waters do not mix with the upper layers of water that receive oxygen from the atmosphere. These hydrochemical characteristics, along with the Black Sea reservoir's climatic features and social/economic impacts of its use, influence the character of shelf vegetation, its vertical and horizontal distribution, and specific structure. Policy makers within the Russian Federation need accurate, up-to-date spatial data to be able to make informed decisions about water resource management.
There are many factors that influence the ecology of water bodies, and GIS makes analysis and planning for an improved sea environment easier with its visualization capabilities. Analysts at St. Petersburg Electrotechnical University are using ArcGIS software for data management, to create thematic maps, and to support stakeholders in decision making as they administer marine policies. They have developed a system for monitoring and estimating water quality that facilitates managing large amounts of data for mapping and analysis. This helps organization set pollution standards and conduct appropriate wildlife management.

Developing the System

The process for creating the system to estimate water conditions uses ArcInfo software. The GIS contains the following:
  • Basemap, which includes cities, rivers, seas, forests, roads, borders, and railways
  • Geodatabase of the ecological situation, including observation posts on the Black Sea, a table of pollutant concentrations, and a table of maximum permissible concentrations of pollutants
click to enlarge
Designated observation sites along the Black Sea with tables for substance concentrations and for maximum permissible concentrations of pollutants.
To estimate water quality, analysts compare data from observation posts with a control and calculate water characteristics using specific criteria. They can process large amounts of data to estimate when a specific observation post will exceed the maximum permissible concentrations of a pollutant. The analysts use this process to determine the changes in substance concentrations in the coastal area of the Black Sea. Values of a maximum concentration level are used as a measure of a water body's impurity.
Team members charted over time the changes of substance concentration, which they used to determine when an observation site would exceed the maximum permissible value of substance concentration. The interpolated values of pollution concentration at points where values were unknown was determined using ArcGIS Geostatistical Analyst.

Monitoring the Black Sea's Water Resources

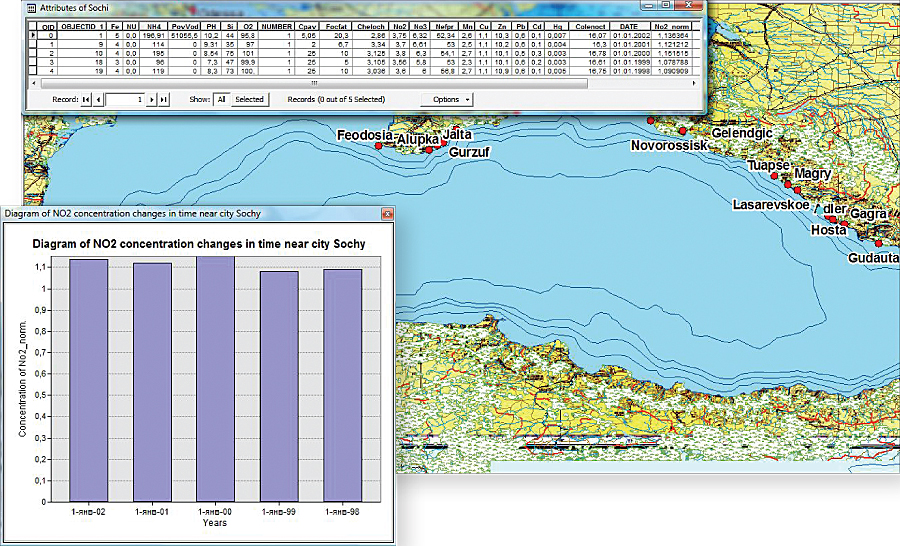
The researchers discovered rather high concentrations of pollutants along the coasts of Sochi, Hosta, Adler, and Gelengic. Over time, the level of pollutants, such as hydrocarbons, stabilized and didn't exceed 0.03 mg/l in the ports of Anapa, Novorossisk, and Gelengic. The maximum concentration values in these three ports were lower than in 2000; in the port of Tuapse, they were two times higher; and in the port of Sochi, they were approximately the same value. All the average and maximum concentration surface-active material in the coastal zone from Anapa to Sochi for the last five years did not exceed the limit of 25 mkg/l.
click to enlarge
The change of NO2 concentration in Sochi over time.
GIS implementations are helping decision makers in the Russian Federation who are working to resolve the pollution problem in the Black Sea. Values of pollutant concentrations have been substantially lowered, and there is optimism that pollution will not be an issue during the 2014 Winter Olympics. (Source: ArcNews, ESRI)


By Natalia Kurakina and Anastasia Minina, Department of Information Systems, St. Petersburg Electrotechnical University
More Information
For more information, contact Natalia Kurakina (e-mail: nikurakina@eltech.ru) or Anastasia Minina (e-mail: AAMinina@mail.ru).

Underwater Vehicles Provide In-Depth Water Supply System Bathymetry

Until recently, the City of New Bedford, Massachusetts, had to operate with century-old reservoir survey data to support the city's decision making for economic development issues. Emerging technologies in GIS and autonomous underwater vehicles (AUVs) have presented a solid foundation on which to base a methodology for an accurate and modernized visualization of bathymetric data. The concept of using AUVs in conjunction with GIS provides an attractive alternative to develop the required bathymetric data needed for a host of contemporary water management requirements. The goal of the project described in this article was to make bathymetric visualization a simpler, quicker, and more affordable process.
see enlargement
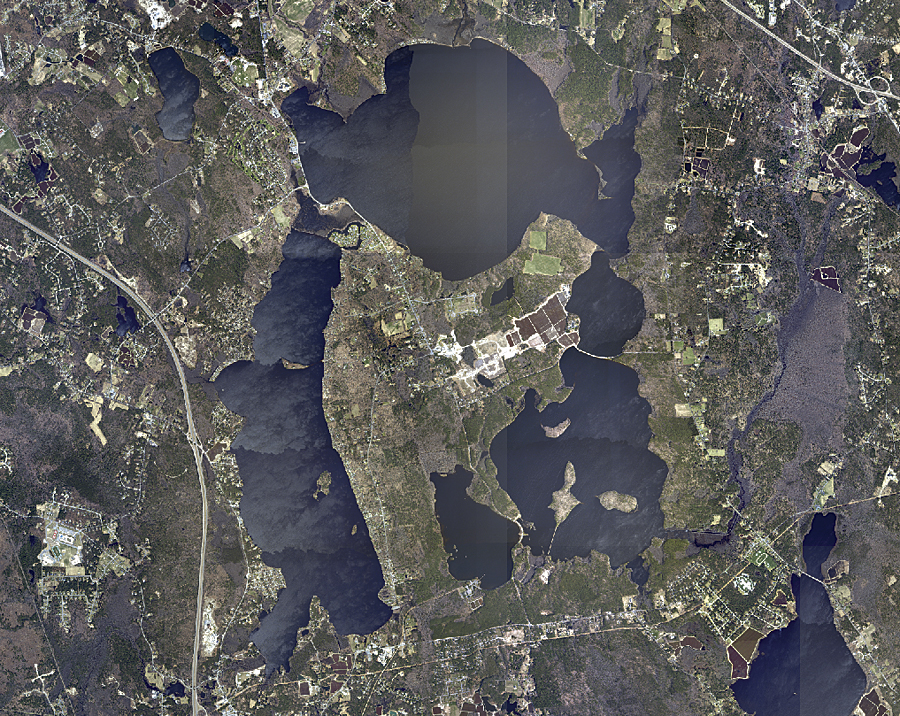
Satellite image of New Bedford's Five Pond System.


The opportunity to employ GIS for bathymetric surveying was based on the need to provide output data to the customer. During summer 2008, the Advanced Technology and Manufacturing Center (ATMC) at the University of Massachusetts Dartmouth was approached by the City of New Bedford to survey a reservoir pond system, which they decided to jointly conduct using AUVs. ATMC was already using ArcGIS for several projects with the City of New Bedford and decided to exploit this software to ingest, archive, and process the vast amounts of data collected by the AUVs. This technology offered a cost-effective method to obtain accurate and up-to-date information on the pond system and a level of detail not previously possible.


The methodology used in this assessment made use of multiple Iver2 AUVs' sampling capacity, providing tens of thousands of data points per pond, compared to less than 100 sampling points as used in the manual depth hydrographic survey performed over a century ago. Modern GIS interpolation techniques provide an evaluation of a pond's bathymetric features by creating a high-resolution assessment of the pond's geometric characteristics. In doing so, the volume calculation techniques are more accurate than traditional methods, and a confident assessment can be provided. Prior to the development of this technology, updating bathymetry data required hundreds of manually obtained depth readings at a huge labor cost with results far less accurate than what was accomplished using ArcGIS and modern AUVs.

Data was collected using the AUV technologies mentioned above, and analyses of the results were done using a combination of existing and custom-developed software tools.

Benefits of the Merger of Technologies

This shows the New Bedford pond system with bathymetric overlays.

The concept of summing all scattered points to find the average depth will produce a biased result since the data is not uniformly distributed. ArcGIS provides tools that can approximate a uniform distribution of the depth measurements. By collecting thousands of depth samples per pond, the ATMC team was able to estimate the depth values at uniformly distributed locations. To produce an average depth estimate for the pond, depths at uniform locations are required. By collecting the depth values measured throughout each mission within a given boundary (the surrounding edge of each body of water), the GIS was then used to produce the pond floor through an interpolation process that essentially considers nearby points and trends. From here, the software assigns estimated depth values as a pixelated area across the entire region of the pond. Having created a uniform distribution, an assessment of average depth can be made based on the number of points factored and the accumulated depth. The interpolation methods used provide an accurate way of estimating the average depth.

Interpolating Data

Once the physical data collection is completed, the GIS provides postprocessing analysis, allowing the user to translate the data into a visual rendering. The GIS produces a layering of the entire study area on its global mapping system. Given the data, ArcGIS provides a variety of interpolation methods that estimate the unknown values for the entire study area. The goal is to create surfaces that represent an accurate and logical depiction of the data. Any location's values are estimated based on the values of points nearby. By using a selection of embedded algorithms, GIS converts recorded points into a practical, visually appealing depiction, simplifying a user's task of interpreting relatively complex data.

An Iver2 autonomous underwater vehicle just below the surface on a mission.
By making use of these embedded features, such as the several interpolation techniques, the points collected are computationally grouped into bodies of corresponding colors or depths. This method of interpolating depths enables simplified understanding of what is actually occurring on the pond's floor, an otherwise difficult and impractical task. These hydrographic surfaces are then used for volume calculations.

Because the two platforms were not immediately compatible, the ATMC team developed several utilities to facilitate moving the raw data output from the AUV to ArcGIS. These utilities enable fast generation of bathymetric surfaces; the outputs were typically generated within 15 minutes of mission completion. The utilities consist of algorithms that ingest the raw data from the Iver2 and produce an ArcGIS software-compatible file format, which is then converted into a feature class, necessary for ArcGIS manipulation.

Quick and Cost Effective

The effort described here—which paired modern GIS functionality with low-cost, highly capable, person-portable autonomous underwater vehicles—demonstrated robust bathymetric surveying in ponds, watersheds, and coastal systems. This state-of-the-art technology is more accurate than techniques used in the past. Manual bathymetric sampling is slow, impractical, expensive, and inaccurate compared to the techniques used in this modern assessment. Modern GIS interpolation techniques can exploit the data collected by an AUV and provide an evaluation of bathymetric features by creating a high-resolution assessment of the pond's geometric characteristics. In doing so, the volume calculation techniques are more accurate than traditional methods and, once developed, allow quick turnaround in future surveys. (Source: ArcNews, ESRI)

More Information
For more information, contact Keith MacKenzie, project manager (e-mail: kmackenzie@umassd.edu); Flavio Fernandes (e-mail: u_f1fernande@umassd.edu), intern at the Advanced Technology and Manufacturing Center, University of Massachusetts Dartmouth; or Christopher Laliberte (e-mail: u_claliberte@umassd.edu), graduate of University of Massachusetts Dartmouth.

Using GIS to Remedy Coal Mining's Aftermath

Abandoned coal mines cover hundreds of thousands of acres throughout the eastern United States. As such, having accurate maps of them is important to keep those involved in their cleanup spatially informed. In Pennsylvania, a regional nonprofit abandoned mine reclamation group is promoting the use of a state-of-the-art GIS mapping tool to assist in the reclamation of mined-out land. The tool, created by the Eastern Pennsylvania Coalition for Abandoned Mine Reclamation (EPCAMR), has proved successful in maximizing the limited funds available for restoring this blighted land to its approximate premined state.
click to enlarge
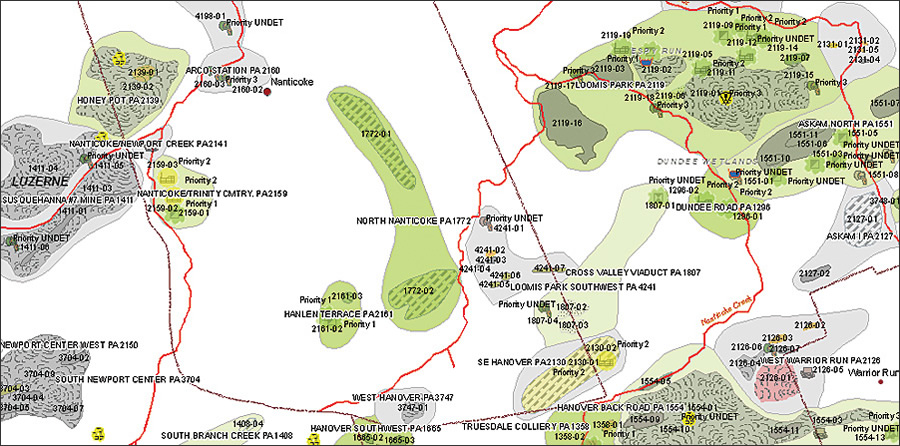
Map depicting specific abandoned mine problem features and active mining permits. Green tinted areas are reclaimed, while red and yellow tinted areas represent unreclaimed high-priority features.

As recently as 30 years ago, coal mining companies weren't required to clean up and restore the land they excavated. Streams ran orange, green, and white with heavy metals leached from nearby mines. Strip pits with sheer cliffs were a hazard, causing many people to fall to their deaths. Pennsylvania was left with more than 200,000 acres of mine-scarred land and 5,000 miles of polluted streams. As the impact of surface mining became evident in the mid-1970s, Congress passed the Surface Mine Control and Reclamation Act (SMCRA) in 1977. SMCRA attached a per-ton fee to all extracted
coal to create an interest-accruing federal reclamation fund. The fund is maintained by the United States Department of the Interior Office of Surface Mining (OSM) and is dispersed to states and Native American tribes that still face problems caused by coal mines abandoned before 1977.

Because Pennsylvania leads most states in the amount of reclamation that needs to be done, in 2006, Congress authorized an increase in Pennsylvania's reclamation allotment to $1.4 billion over the next 15 years. With so many abandoned mines still awaiting reclamation in Pennsylvania, EPCAMR sought a way to more efficiently pinpoint the areas in need of remediation. Although the new allotment will significantly increase the work that can be done, $1.4 billion still needs to go a long way.

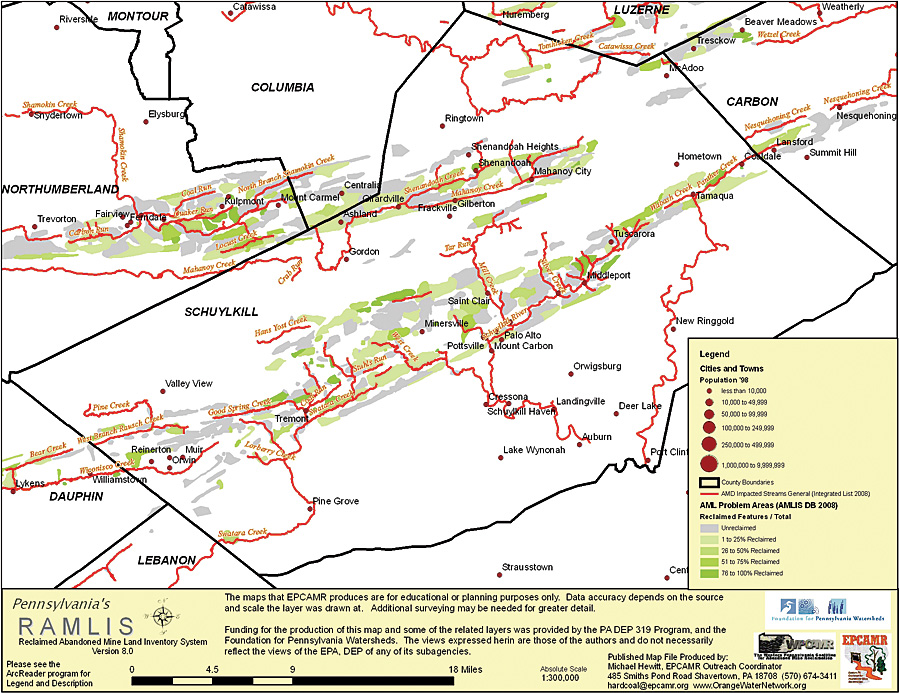
With a grant from the Foundation for Pennsylvania Watersheds and an agreement with the OSM's Technical Innovation Professional Services (TIPS) Program, EPCAMR used ArcGIS Desktop software's ArcMap and the Publisher extension to create a tool to keep track of abandoned mines. Called the Reclaimed Abandoned Mine Land Information System (RAMLIS), the application creates highly detailed maps at different scales with layers of information that help identify the areas most in need of remediation. RAMLIS also combines state, federal, and local data in maps that reveal all the components of mines, such as mine discharge points, backfilled strip pits, and reclaimed mine shafts. To work safely and effectively, reclamation crews must know the location of these features. Knowing the location of flooded voids, for example, can potentially save enormous expense—and even lives.

The dynamic, interactive maps assist reclamation efforts because they allow the public and local municipalities to understand what features are contained within a mine site and which features can be fixed using SMCRA funding. Map layers show a multitude of problems caused by leaving mines unattended. For example, the quality of water running off these sites is identified in a stream layer from the Pennsylvania Department of Environmental Protection (DEP) called the Integrated List of Waters. This layer shows streams that do not meet their intended use because pollution from the seepage of mining by-products drains into the stream. By turning on this layer, users can see certain sections of a stream that are impacted by mine drainage of heavy metals, such as iron or aluminum, into the stream. Toxic discharge from this runoff also decreases the pH to uninhabitable levels for fish and other aquatic organisms.

Map showing streams impacted by pollutant runoff from abandoned mine in Schuykill County, Pennsylvania.
RAMLIS is also useful for civic management/land development. Elected officials can add their layers to this system for further analysis of a problem (e.g., input a tax parcel layer to examine neighborhoods for economic impacts because of local mine hazards). Local and county planning commissions use the program as a tool for land-use planning, storm water and floodplain management, and a host of other development-related issues. The tool contains road centerlines; municipal, county, and watershed boundaries; full-color aerial photos; and land-use datasets as background data.

Recently, EPCAMR took the application on the road to demonstrate its benefits to municipal officials throughout northeastern Pennsylvania. The goal of the workshops was to show how ArcGIS not only maximizes the value of reclamation budgets but also increases public awareness of mine hazards. In a flagging economy, and following a string of harrowing coal mine accidents in the past few years, EPCAMR's message couldn't have been more timely.

To show municipal planners and public officials what GIS was capable of, EPCAMR offered to produce up to three free maps for municipalities containing abandoned mines. One map was required to depict mined-out land, while the content of the other two was left up to elected officials based on available data. In a survey conducted after the tour, many of these municipalities responded that the new maps were helpful, since the old maps used for planning and maintenance were an average of 15 years old. Several municipalities were also interested in obtaining their own GIS software and technicians.

"If we can convince public officials who are in charge of making sound land-use planning decisions for their communities, it might turn the light bulb on for them," says Robert Hughes, regional coordinator for EPCAMR. "We're trying to say, 'Let us show you how GIS can be used to effectively allocate a limited amount of funding and resources over time.'" ArcGIS helps municipalities, as well as state and federal officials, by providing concrete evidence of potential health and safety hazards, such as subsidence-prone areas. "Pollution from residual coal mine chemicals, illegal dumping, and land cave-ins is a real concern to some of these communities," says Hughes. "GIS gives us the best solution to identify and respond to these problems on a local level."

To date, approximately 22,500 acres of mine lands in Pennsylvania have been cleaned up, and more than 280 mine drainage treatment systems are in place to treat polluted water. EPCAMR hopes the workshops in Pennsylvania continue to spread the GIS message to other organizations. (Source: ArcNews, ESRI)

More Information

For questions regarding the use of GIS for mine reclamation, contact Robert Hughes, executive director, EPCAMR, or Michael Hewitt, watershed outreach coordinator, EPCAMR (e-mail: hardcoal@epcamr.org, tel.: 570-674-7993). To learn more about Pennsylvania's mine reclamation work, visit www.orangewaternetwork.org.

Which GIS ArcGIS software is Best?

The good thing about GIS software is, nothing much can go wrong. Nevertheless, if you choose a medium that does not match your needs perfectly they may not be as effective as the could be.  Poor health has detrimental effects on concentration, which greatly impacts on the ability to think and study, so there are external factors at play here.  Attending a physical GIS software is a technique used to get even more out of the best GIS software courses materials.

The GIS sections take a total of 14 hours to complete, with each of its four parts taking 4.5 hours to complete.  Trying to pass the GIS software is not an easy task, but you don’t need to do it alone. Interesting times are ahead it seems and finally sorting out which GIS course materials are best is so inspiring every time I read about it. Ideally the best GIS mapping software should be made entirely free. Sadly this is not the case although there are some very affordable options available.

If you enjoy working with numbers and learning the latest groundwater software, there are many job opportunities waiting for you after you earn your accounting degree. ArcGIS offers on line classes, live classes, cram sessions, and self study cd’s to work at your own pace. This process can take from 6 weeks up to 8 weeks. Many people find it overwhelming when trying to study for all four GIS geographic information system hardware at the same time. The course objectives in this program are to impart a basic knowledge of the accounting practice as it relates to business finance, state and local taxation for businesses and auditing and accounting for SDI (spatial data infrastructures).


As always, a good GIS software hardware does one hell of a job. As a navigation for small urban planning, you will be dealing with topography, cartography, or some other version of geographic software. OR, specialize in helping a small urban planning owner make the tough decisions so that they make a profit instead of a loss and won’t have to close up shop. I think you’ll find that ArcGIS and ArcView software are equal to the occasion in preparing you for this. I know you want to understand what’s going on here. I’ll try and make it very simple for you.

There’s simply too much material to familiarize yourself with all at once. If I were promoting a GIS software hardware course I would choose one that had an abundance of video, audio, text, sample questions and a student online.

Mac Book Pro 15" $1000

mac book pro 15" $1000 call matis 559-412-1538 thannx


Apple MacBook Pro "Core 2 Duo" 2.5 15" (08) Specs
Early 2008 - MB134LL/A - A1260 - 2198 - MacBookPro4,1

MacBook Pro Main | Ports | Q&A | PDF Manual | Bookmark & Share


The Apple MacBook Pro "Core 2 Duo" 2.5 15-Inch (Early 2008/Penryn) features a 45 nm "Penryn" 2.5 GHz "Core 2 Duo" processor (T9300), with two independent processor "cores", a 6 MB shared "on chip" level 2 cache, an 800 MHz frontside bus, 2.0 GB of 667 MHz PC2-5300 DDR2 SDRAM, a 250 GB (5400 RPM) hard drive with "Sudden Motion Sensor" technology, and an 8X dual-layer DVD±RW/CD-RW SuperDrive. It also includes a NVIDIA GeForce 8600M GT graphics processor with 512 MB of GDDR3 SDRAM and dual-link DVI functionality, and an antiglare LED-backlit 15.4" widescreen 1440x900 active-matrix display (a glossy display is available via build-to-order).

With the exception of the keyboard -- which retains the "ambient lighting" capability but eliminates the "embedded numeric keypad", replaces the "enter" key next to the right-hand "command" key with a second option key, and has a different function key mapping -- and the trackpad -- which adds support for "multi-touch gesturing" (two finger scroll, pinch, rotate, swipe, tap, double-tap, and drag) -- the 15-Inch "Early 2008/Penryn" MacBook Pro models effectively are externally identical compared to the previously released "Mid-2007/Santa Rosa" systems. The "MagSafe" power connector and integrated iSight video camera also remain (the previously bundled Apple Remote is a US$19 extra).