A GIS integrated approach has been used to assess the impact of urbanization on groundwater resources of the Ajmer city, India. Urban growth has been estimated using remote sensing imageries and subsequent use of (from year 1989 to 2005) digital image processing techniques, like image extraction, rectification, restoration, and classification.
Groundwater recharge has been estimated using a simple water balance approach known as Water Level Fluctuation Methodology, which is directly implemented in GIS on a cell basis. Further, impact of urbanization on groundwater resources (recharge and quality) have been studied using overlay analysis of interrelated themes in GIS.
The present study is useful in identifying the potential threats to groundwater of area, and to generate a water resource database for overall development on a sustainable basis, which can help urban planners and decision makes for the policy decisions.
Groundwater vulnerability and risk mapping in a geologically complex area by using stable isotopes, remote sensing and GIS techniques
(GIS) The Paluxy aquifer in north-central Texas is composed primarily of Lower Cretaceous clastics. This aquifer provides water for both domestic and agricultural purposes in the region. The study area for this investigation incorporates the outcrop and recharge areas, as well as the confined and unconfined portions of the aquifer. The purpose of this investigation is to perform a groundwater vulnerability assessment on the Paluxy aquifer using the GRASS 4.1 geographic information system (GIS) combined with a modified DRASTIC approach.
DRASTIC is an acronym for the variables that control the groundwater pollution potential (Depth to water, net Recharge, Aquifer media, Soil media, Topography, Impact of the vadose zone, and Conductivity of the aquifer). Using such an approach allows one to investigate the potential for groundwater contamination on a regional, rather than site-specific, scale.
Based upon data from variables such as soil permeability, depth to water, aquifer hydraulic conductivity, and topography, subjective numerical weightings have been assigned according to the variable's relative importance in regional groundwater quality. The weights for each variable comprise a GIS map layer. These map layers are combined to formulate the final groundwater pollution potential map.
Using this method of investigation, the pollution potential map for the study area classifies 47% of the area as having low pollution potential, 26% as having moderate pollution potential, 22% as having high pollution potential, and 5% as having very high pollution potential (Fig. 1).

Original article:
DRASTIC is an acronym for the variables that control the groundwater pollution potential (Depth to water, net Recharge, Aquifer media, Soil media, Topography, Impact of the vadose zone, and Conductivity of the aquifer). Using such an approach allows one to investigate the potential for groundwater contamination on a regional, rather than site-specific, scale.
Based upon data from variables such as soil permeability, depth to water, aquifer hydraulic conductivity, and topography, subjective numerical weightings have been assigned according to the variable's relative importance in regional groundwater quality. The weights for each variable comprise a GIS map layer. These map layers are combined to formulate the final groundwater pollution potential map.
Using this method of investigation, the pollution potential map for the study area classifies 47% of the area as having low pollution potential, 26% as having moderate pollution potential, 22% as having high pollution potential, and 5% as having very high pollution potential (Fig. 1).

Figure 1. Generalized pollution potential map of the Paluxy aquifer, north-central Texas.
An Aquifer Vulnerability Assessment of the Paluxy Aquifer, Central Texas, USA, Using GIS and a Modified DRASTIC Approach
Todd G. Fritch, Cleavy L. McKnight, Joe C. Yelderman Jr. and Jeff G. Arnold
Environmental Management, Volume 25, Number 3 / March, 2000
Todd G. Fritch, Cleavy L. McKnight, Joe C. Yelderman Jr. and Jeff G. Arnold
Environmental Management, Volume 25, Number 3 / March, 2000
Regulating Illegal Piggery Waste Runoff
GPS/GIS in American Samoa, South Pacific.
The raising of pigs in American Samoa represents an important part of the Samoan culture. Pigs are consumed during a variety of social events, from birthdays to funerals and from weddings to farewell parties (groundwater).
However, pigpen (piggery) waste disposal has been largely uncontrolled, resulting in volumes of untreated pig urine and feces contaminating drinking water, streams, and nearshore ocean water. The impacts of pig waste on human health and water quality are now critical, and illness and death due to pig-related disease are documented.
In April 2006, the American Samoa Environmental Protection Agency (ASEPA), in an attempt to regulate this nonpoint source pollution, launched the Piggery Compliance Program. The purpose of this program is to inventory all existing piggeries, educate piggery owners on safe practices for the raising of pigs, and enforce the current regulations. The goal of the program is to legalize those piggeries that are compliant with current regulations and to relocate or remove all noncompliant piggeries that represent a threat to human and environmental health.
In a country where physical addresses do not exist, GPS and GIS technologies were essential for the success of this program. The exact location of each piggery was acquired using GPS units, while information regarding each piggery was easily stored, edited, and retrieved using GIS technology.
American Samoa is a U.S. territory located in the South Pacific between Hawaii and New Zealand. It is made up of five islands and two atolls with a population of 60,000 people, most of whom live along the coast of the main island, Tutuila (approximately 130 square kilometers). American Samoa's lifestyle was based on traditional customs and a subsistence economy until the 1960s, when President Kennedy made funds available to modernize the territory and jolted its people into 20th century life. The population has tripled since then, and a new issue has arisen: stream water once used for household chores is now contaminated by fecal bacteria.
In April 2006, ASEPA personnel and volunteers from other agencies (a total of about 30 persons) were trained to use the three Trimble XP GPS units available. They visited each house and road of the territory, recording piggery and solid waste locations, educating piggery owners, and collecting piggery and owner information.
ArcView was used in the two different phases of the piggery compliance program: phase 1, inventory and education, and phase 2, enforcement.
Before the fieldwork, the teams were given paper maps of the area to survey, where they wrote notes on piggeries and solid waste locations and checked the visited houses one by one. This step was very important in case of GPS failure or misuse. QuickBird satellite images were also used to identify structures that did not appear in the available GIS shapefiles.
Pathfinder Office software was used to create a data dictionary to assure the systematic and correct collection of the data for each piggery. It was also used at the end of each working day to download, differentially correct, and export the data into a personal geodatabase. Data was collected using TerraSync software. Editing to correct wrong locations (the point was taken at a distance from the piggery) and spelling mistakes was also done on a nearly daily basis.
ASEPA surveys found approximately 8,300 pigs contained in 1,005 piggeries, of which only 3 percent were compliant with current regulations. After the inventory/education phase, spatial analysis was used to identify those piggeries that represented a major threat to human health, focusing on those located within 50 feet of streams in highly populated villages. The database was also enlarged to contain information regarding enforcement action for each piggery.
The geodatabase is essential for a rapid retrieval of data, and it is used to identify and relocate piggeries after complaints and to track warnings, citations, relocation, and removal of piggeries during the enforcement phase of the program (phase 2).
The GPS/GIS approach to this project proved to be time efficient and cost-effective. Frequent and uncomplicated training of personnel by ASEPA GIS specialists allows having two to three teams always ready for fieldwork, and the easy interface of ArcView allows enforcement officials to access the database and retrieve information even without a deep understanding of GIS principles.
This same approach is now being applied to the enforcement of illegal solid waste in American Samoa, and because of its straightforwardness and cost-effectiveness, it is recommended to other Pacific islands and small communities that want to locate and eradicate sources of pollution in a limited time frame and with limited financial resources. (Source: ArcNews, ESRI)
By Barbara Zennaro, Environmental Scientist, American Samoa Environmental Protection Agency
For more information, contact Barbara Zennaro (e-mail: zennarob@gmail.com).
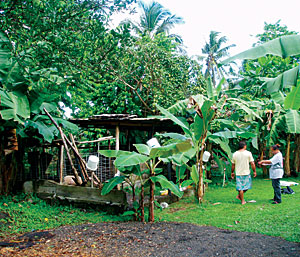 A surveyor and an educator are inspecting a piggery and educating the piggery owner. |
However, pigpen (piggery) waste disposal has been largely uncontrolled, resulting in volumes of untreated pig urine and feces contaminating drinking water, streams, and nearshore ocean water. The impacts of pig waste on human health and water quality are now critical, and illness and death due to pig-related disease are documented.
In April 2006, the American Samoa Environmental Protection Agency (ASEPA), in an attempt to regulate this nonpoint source pollution, launched the Piggery Compliance Program. The purpose of this program is to inventory all existing piggeries, educate piggery owners on safe practices for the raising of pigs, and enforce the current regulations. The goal of the program is to legalize those piggeries that are compliant with current regulations and to relocate or remove all noncompliant piggeries that represent a threat to human and environmental health.
In a country where physical addresses do not exist, GPS and GIS technologies were essential for the success of this program. The exact location of each piggery was acquired using GPS units, while information regarding each piggery was easily stored, edited, and retrieved using GIS technology.
American Samoa is a U.S. territory located in the South Pacific between Hawaii and New Zealand. It is made up of five islands and two atolls with a population of 60,000 people, most of whom live along the coast of the main island, Tutuila (approximately 130 square kilometers). American Samoa's lifestyle was based on traditional customs and a subsistence economy until the 1960s, when President Kennedy made funds available to modernize the territory and jolted its people into 20th century life. The population has tripled since then, and a new issue has arisen: stream water once used for household chores is now contaminated by fecal bacteria.
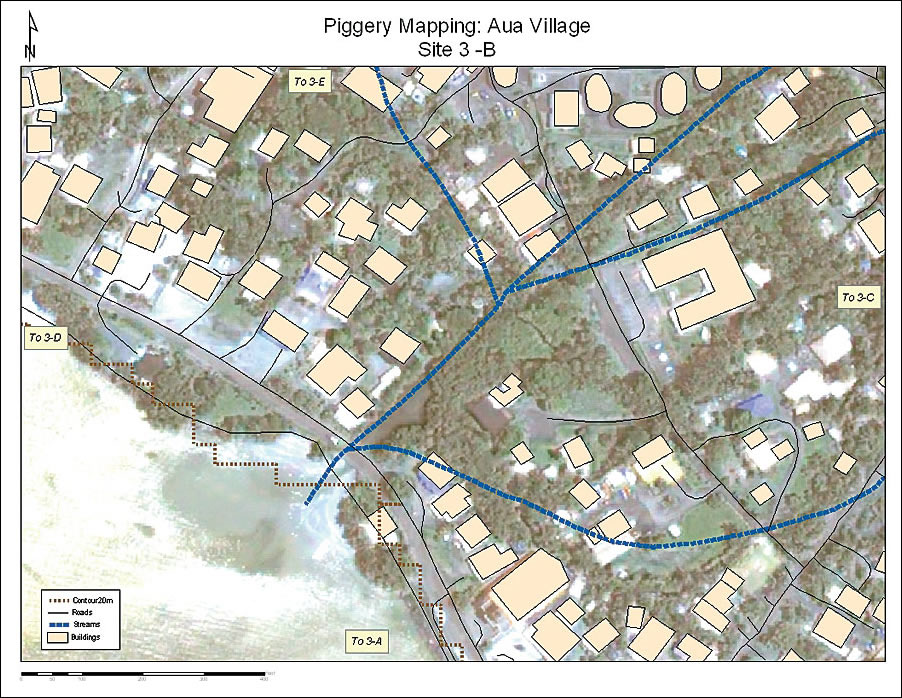 This is an example of the maps that were given to the surveyors before fieldwork. | |
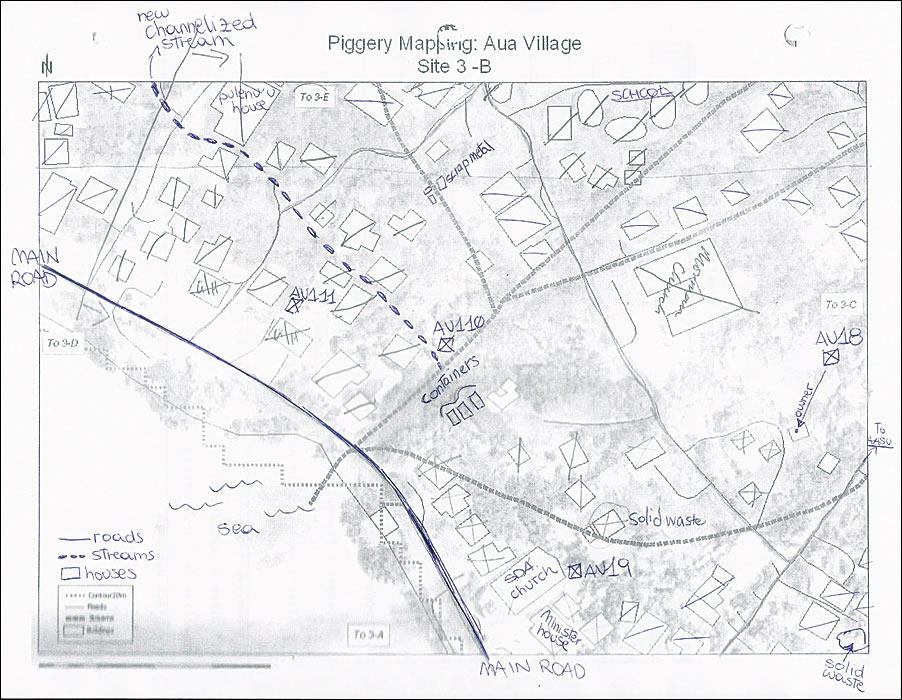 The same map after fieldwork. The surveyor wrote notes on piggery and solid waste locations, as well as indicated major buildings (such as churches) and the location of the piggery owner's house. |
In April 2006, ASEPA personnel and volunteers from other agencies (a total of about 30 persons) were trained to use the three Trimble XP GPS units available. They visited each house and road of the territory, recording piggery and solid waste locations, educating piggery owners, and collecting piggery and owner information.
ArcView was used in the two different phases of the piggery compliance program: phase 1, inventory and education, and phase 2, enforcement.
Before the fieldwork, the teams were given paper maps of the area to survey, where they wrote notes on piggeries and solid waste locations and checked the visited houses one by one. This step was very important in case of GPS failure or misuse. QuickBird satellite images were also used to identify structures that did not appear in the available GIS shapefiles.
Pathfinder Office software was used to create a data dictionary to assure the systematic and correct collection of the data for each piggery. It was also used at the end of each working day to download, differentially correct, and export the data into a personal geodatabase. Data was collected using TerraSync software. Editing to correct wrong locations (the point was taken at a distance from the piggery) and spelling mistakes was also done on a nearly daily basis.
ASEPA surveys found approximately 8,300 pigs contained in 1,005 piggeries, of which only 3 percent were compliant with current regulations. After the inventory/education phase, spatial analysis was used to identify those piggeries that represented a major threat to human health, focusing on those located within 50 feet of streams in highly populated villages. The database was also enlarged to contain information regarding enforcement action for each piggery.
The geodatabase is essential for a rapid retrieval of data, and it is used to identify and relocate piggeries after complaints and to track warnings, citations, relocation, and removal of piggeries during the enforcement phase of the program (phase 2).
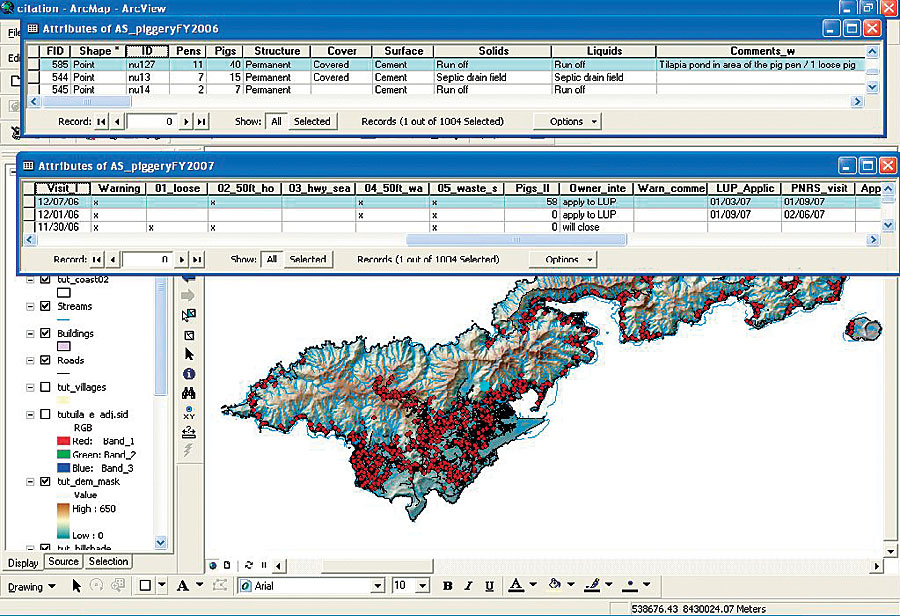 The attribute table is used to identify piggeries. |
The GPS/GIS approach to this project proved to be time efficient and cost-effective. Frequent and uncomplicated training of personnel by ASEPA GIS specialists allows having two to three teams always ready for fieldwork, and the easy interface of ArcView allows enforcement officials to access the database and retrieve information even without a deep understanding of GIS principles.
This same approach is now being applied to the enforcement of illegal solid waste in American Samoa, and because of its straightforwardness and cost-effectiveness, it is recommended to other Pacific islands and small communities that want to locate and eradicate sources of pollution in a limited time frame and with limited financial resources. (Source: ArcNews, ESRI)
By Barbara Zennaro, Environmental Scientist, American Samoa Environmental Protection Agency
For more information, contact Barbara Zennaro (e-mail: zennarob@gmail.com).
GIS for identification of suitable areas for artificial recharge (Meimeh Basin, Isfahan, Iran)
Flood spreading is an inexpensive method for flood mitigation and artificial recharge of aquifers that results in a large budget return for relatively small investment.
It is necessary to study some regional characteristics in order to determine the appropriate areas for artificial groundwater recharge by flood spreading in Meimeh Basin, Isfahan Province, Iran. Necessary regional characteristics to be studied are: slope, infiltration rate, sediment thickness, transmissivity, and water quality. In this research to identify suitable areas for artificial recharge several thematic layers were prepared, assigning each layer to one of the mentioned characteristics.
The thematic layers were classified to several classes based on the existing criteria. All of the classes of the thematic layers were integrated and analyzed using a decision support system (DSS) in a geographical information system (GIS) environment. Figure 1 shows a part of the decision trees of the system.

Finally suitability of the integrated classes for artificial recharge was identified in which the following classes were separated: (i) Very suitable, (ii) suitable, (iii) moderate suitability, and (iv) unsuitable (Fig. 2).

The validity of the generated model was verified by applying the model to a number of successful floodwater spreading stations throughout Iran. The verified model showed satisfactory results for all of the stations. The results for Meimeh Basin showed that about 70% of the Quaternary sediments in the studied area are suitable and moderately suitable for artificial recharge by flood spreading.
Original Article:
Integrating GIS and DSS for identification of suitable areas for artificial recharge, case study Meimeh Basin, Isfahan, Iran
Jafar Ghayoumian, B. Ghermezcheshme, S. Feiznia and A. A. Noroozi
Environmental Geology, Volume 47, Number 4 / March, 2005
It is necessary to study some regional characteristics in order to determine the appropriate areas for artificial groundwater recharge by flood spreading in Meimeh Basin, Isfahan Province, Iran. Necessary regional characteristics to be studied are: slope, infiltration rate, sediment thickness, transmissivity, and water quality. In this research to identify suitable areas for artificial recharge several thematic layers were prepared, assigning each layer to one of the mentioned characteristics.
The thematic layers were classified to several classes based on the existing criteria. All of the classes of the thematic layers were integrated and analyzed using a decision support system (DSS) in a geographical information system (GIS) environment. Figure 1 shows a part of the decision trees of the system.

Fig. 1 A part of decision tree
Finally suitability of the integrated classes for artificial recharge was identified in which the following classes were separated: (i) Very suitable, (ii) suitable, (iii) moderate suitability, and (iv) unsuitable (Fig. 2).

Fig. 2 Suitability of the study area for artificial recharge
The validity of the generated model was verified by applying the model to a number of successful floodwater spreading stations throughout Iran. The verified model showed satisfactory results for all of the stations. The results for Meimeh Basin showed that about 70% of the Quaternary sediments in the studied area are suitable and moderately suitable for artificial recharge by flood spreading.
Original Article:
Integrating GIS and DSS for identification of suitable areas for artificial recharge, case study Meimeh Basin, Isfahan, Iran
Jafar Ghayoumian, B. Ghermezcheshme, S. Feiznia and A. A. Noroozi
Environmental Geology, Volume 47, Number 4 / March, 2005
Subscribe to:
Posts (Atom)