Klamath Basin Rangeland Trust Builds a Surface Water, Groundwater, and Vegetation Monitoring Network With GIS


click to see enlargement
As well as being a valuable tool in the monitoring network design, GIS was heavily used to generate figures that have been used in reports and presentations to a variety of federal agencies, potential private funding sources, and local ranchers.
Large Drainage Basin in Southern Oregon and Northern California (GIS and groundwater).

The Klamath Basin Rangeland Trust (KBRT) was created in response to the current water crisis in the Klamath Basin, a large drainage basin that is located in southern Oregon and northern California in the western United States. The water crisis was widely publicized in the summer of 2001 when the need to supply sufficient water resources to endangered and threatened fish species (including the Klamath River coho salmon, interior redband trout, bull trout, Lost River sucker, and shortnose sucker) resulted in the shutdown of irrigation water to farmers in the Klamath Project Irrigation District and the loss of their crops. The goal of KBRT is to increase the quantity and quality of water available for use by both farmers and fish in the basin by changing land management techniques and conserving irrigation water high in the Upper Klamath Basin.

KBRT has focused its efforts in the Wood River Valley, a small drainage area in the Upper Klamath Basin. The majority of land in the valley is currently used for high-density cattle grazing, which is supported by extensive irrigation and drainage systems that divert water from the spring-fed creeks and rivers onto pastures and that drain the low-lying, wetland areas, allowing cattle to forage. Although this valley makes up only 5 percent of the land area in the upper watershed, almost 25 percent of the water supplied to Upper Klamath Lake originates in this valley due to the high density of artesian springs. KBRT focused on the Wood River Valley because, with such a large amount of water originating from a relatively small area, land use changes by only about 15 ranching operations could significantly augment water supplies to Upper Klamath Lake and other downstream water needs. In 2002, KBRT implemented a new land and water management plan to achieve three goals:

Improving GIS Access to Clean Water in Sub-Saharan Africa

Clean drinking water is hard to find in Mayange, Rwanda (GIS and Groundwater).

That's why a group of university students and two professors from the University of Redlands (U of R) in Redlands, California, traveled to this African region. Using the Geographic Information System (GIS) technology and Global Positioning System (GPS) equipment they brought along, they mapped the area's water sources and collected water use information. Their survey is helping improve access to clean drinking water in the community and in similar communities across sub-Saharan Africa.
click to enlarge
This map shows building density and estimated housing expansion areas in the Mayange sector.

The maps are useful in providing local sustainable development programs with accurate locations of where people get their water. For example, the data can be used to identify areas where water sources are contaminated and support decisions about improving water quality, such as how to protect an open pit water source or where to dig a new water source. Ultimately, this field collection and mapping model may be used for mapping other water networks in Rwanda and other parts of Africa and to contribute to the implementation of sustainable practices in impoverished nations.

"Anything that we can do to improve water quality is going to have a major impact on the population," says Maxwell Baber, Ph.D., associate professor in the Master of Science in Geographic Information Science program at U of R. Baber and Katherine Noble-Goodman, a visiting lecturer in environmental studies at the university, led U of R undergraduate environmental studies students to the rural Mayange sector in 2008 and 2009.

Florida Aquifer Vulnerability Assessment Uses GIS

State Enhances Groundwater and Drinking Water Protection (GIS and groundwater).

Recently developed GIS-based aquifer vulnerability models provide valuable groundwater protection tools with wide-ranging applications throughout Florida. Intended to enhance protection efforts for Florida's fragile drinking water resources, the models provide new options for community planners, public works staff, environmental professionals, storm water and wastewater engineers, and local governments.

These models are extensively used in many areas, including land-use planning, identification of recharge areas, wastewater planning, wellhead protection, identification of environmentally sensitive areas, storm water management, and spring protection.

click to enlarge
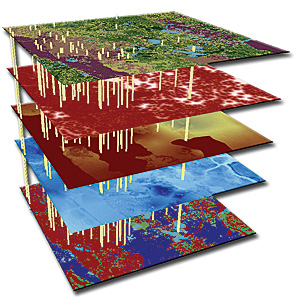
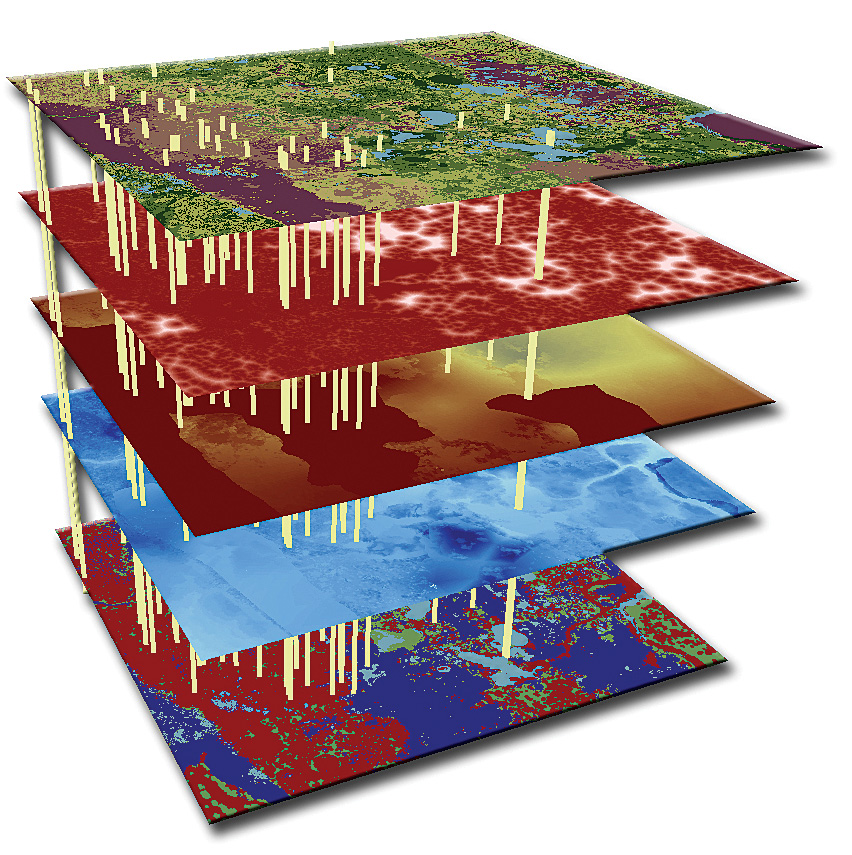
This conceptual model shows the three main components of an aquifer vulnerability assessment: the upper four layers represent soil conductivity; density of sinkhole features, material overlying the aquifer, and estimated aquifer recharge; yellow extruded lines are training points (monitor wells); and the lower layer is the model output, or aquifer vulnerability map.
Aquifers are among the most important sources of drinking water in the United States. In Florida, an estimated 90 percent of drinking water is derived from aquifers, so identifying areas where aquifer systems are more vulnerable to contamination is an essential component of a comprehensive groundwater management and protection program.

The Floridan aquifer system is the most important source of water in Florida, supplying the state with literally billions of gallons of water per day. In addition, the Floridan aquifer system is the source of several hundred freshwater springs, which are valuable resources from a tourism perspective, bringing thousands of visitors to the state per year.

Groundwater protection efforts in Florida are supported by five water management districts, the Florida Department of Community Affairs (FDCA), Florida Department of Environmental Protection (FDEP), Florida Department of Health, and numerous local environmental agencies.

Having a reliable tool that prioritizes areas of higher aquifer vulnerability for both water resource and growth management is a critical requirement for these organizations. Aquifer vulnerability modeling meets this requirement, allowing a proactive approach to the protection of aquifer systems, saving significant time and increasing the value of protection efforts.

Various stakeholders throughout Florida agreed that a new, modern tool was necessary to meet the need to protect groundwater resources. The consensus of many stakeholders was that any tool must take advantage of recent advancements in GIS, be easy to implement, and rely heavily on the state's wealth of geographic and water-resource information that has been carefully collected over the years.

The project that emerged, the Florida Aquifer Vulnerability Assessment (FAVA), was undertaken by the Florida Geological Survey of FDEP. Stakeholders from all of Florida's five water management districts; FDCA; FDEP; Hazlett Kincaid, Inc.; SDII Global Corporation; and the United States Geological Survey (USGS) acted as advisers to the project.

The stakeholder group also peer-reviewed the final model to help strengthen its defensibility, and many of these stakeholders now regularly use FAVA results to complete agency tasks.

The primary goal of the FAVA project was to provide a scientifically defensible water resource management and protection tool that facilitated land-use planning to help minimize impacts on groundwater quality. The project's designers sought to generate meaningful and useful tools to help ensure balanced protection and future use of groundwater resources by characterizing the natural vulnerability of aquifer systems.

ArcGIS Desktop was selected as the development platform for the FAVA project because of the state's existing investment in the software suite. After careful assessment of available modeling techniques that would best suit an aquifer vulnerability analysis, the Arc Spatial Data Modeler, or Arc-SDM, was also selected.

Arc-SDM was programmed by Don Sawatzky under the direction of Dr. Gary Raines of USGS and Dr. Graeme Bonham-Carter of the Geological Survey of Canada. Arc-SDM requires ArcGIS Spatial Analyst and is currently available on ESRI's ArcScripts Web page: arcscripts.esri.com/details.asp?dbid=15341. Analytic techniques of Arc-SDM are being evaluated for inclusion in future versions of ArcGIS Spatial Analyst.

Arc-SDM consists of geoprocessing tools used to generate predictive maps describing probabilities of occurrences of specific events in a study area. The preferred Arc-SDM modeling component selected for the FAVA project was Weights of Evidence; this method is data driven and involves the combination of diverse spatial data to describe and analyze interactions and generate predictive models.


click to enlarge
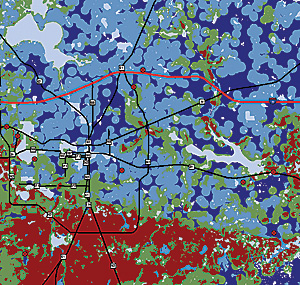
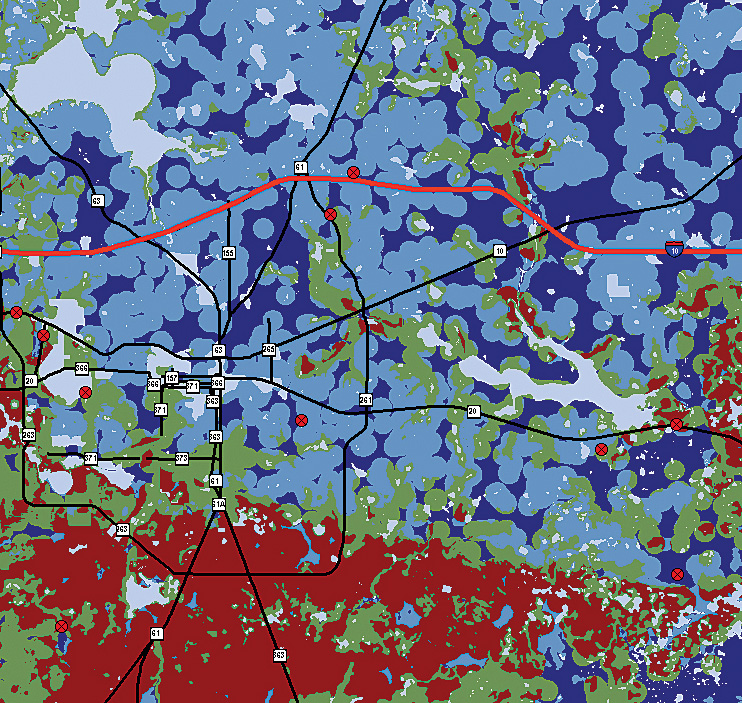
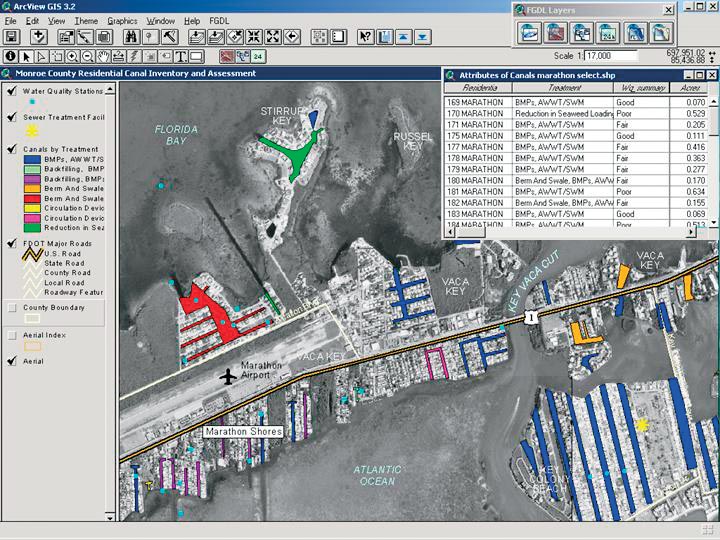
Training points are necessary for the Weights of Evidence analysis in Arc-SDM (shown here in red) and are used as indicators of aquifer vulnerability.
Critical to the success and defensibility of the FAVA project were reliable, consistent datasets. The initial phase of the FAVA project comprised acquisition, development, and attribution of various GIS datasets representing natural hydrogeologic conditions.

This input data included digital elevation, aquifer recharge, subsurface material properties, sinkholes/karst features, soil properties, and water quality. The latter was developed to train the FAVA model, as Weights of Evidence requires a training point dataset, and water quality can be indicative of vulnerability in an aquifer system.

For example, naturally occurring oxygen and nitrogen are generally considered ubiquitous at land surface; further, relatively low concentrations of these analytes occur in well-protected aquifer systems. Where these analytes occur above natural background concentrations in aquifers, one can assume a good interaction between land surface and the aquifer; in other words, vulnerability is higher.

Development of input datasets required heavy use of ArcGIS Desktop extensions, including ArcGIS Geostatistical Analyst, used with borehole point data to generate models of subsurface materials; ArcGIS Spatial Analyst, used to process digital elevation data, extract suspected sinkhole features, and execute the model; and ArcGIS 3D Analyst, used to conceptualize input data layers and generate slides and figures.

The modeling phase of the FAVA project relied on use of Weights of Evidence to generate aquifer vulnerability response themes, which are expressed as probability maps. Probability values of these maps are classified into groups and assigned intuitive names reflecting relative aquifer vulnerability and thus become meaningful to the end user.

These final maps are based on the spatial relationships between the input data and the training points—or points of known vulnerability—and express the likelihood that an area is more or less vulnerable. Maps were generated for all three of Florida's major aquifer systems: the Floridan, intermediate, and surficial aquifer systems.

Following completion of the project and release of model results, three members of the FAVA research team from the Florida Geological Survey formed Advanced GeoSpatial Inc. to meet the growing demand for more aquifer vulnerability modeling projects, specifically for the Floridan aquifer system, the state's most heavily used water resource.

Several local projects were initiated along with an ongoing second phase of the FAVA project intended to improve results of the first project. Currently, six Florida counties—Alachua, Citrus, Leon, Levy, Marion, and Wakulla—have aquifer vulnerability assessments in use in various groundwater protection efforts.
photo of a Floridian aquifer system
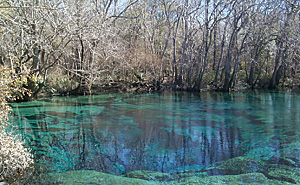
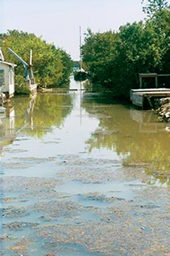
The Floridan aquifer system is the most important freshwater resource in Florida and is also the source of several hundred freshwater springs. Cypress Spring in northwest Florida is a pristine example of these unique natural features. (Photo credit: Kevin Defosset of the Northwest Florida Water Management District, 2003.)

Implications and use of aquifer vulnerability models are widespread and include development of wastewater guidelines, spring protection mapping, establishment of best management practices, and design of nitrate loading models.

Local agencies have extensively applied the results of local scale analyses. For example, the Marion County aquifer vulnerability model is used to prioritize watershed management projects in sensitive areas.

The Leon County aquifer vulnerability model is used to augment extension of sanitary sewer service and to protect Wakulla Spring, located south of the county.

The Alachua County model was adapted into an aquifer-protection zone map complete with other natural features like springshed areas and sinking streams.
Source: ArcNews, ESRI


More Information 
For more information about FAVA and related projects and to access project data, visit www.dep.state.fl.us/geology/programs/hydrogeology/fava.htm or contact Alex Wood, president of Advanced GeoSpatial Inc. (tel.: 480-699-7800, e-mail: awood@adgeo.net); Dr. Jonathan Arthur, Florida Department of Environmental Protection (tel.: 850-488-9380, e-mail: jonathan.arthur@dep.state.fl.us); or Dr. Gary Raines of the United States Geological Survey (retired) (tel.: 775-323-4074, e-mail: garyraines@earthlink.net).

Assessment of groundwater contamination using geographic information systems (Seoul, Korea)

Two sites were selected in order to investigate groundwater contamination and spatial relationships among groundwater quality, topography, geology, landuse and pollution sources.(GIS) One site is the Asan area, an agricultural district where pollution sources are scattered and which is mainly underlain by granite of Cretaceous age. The other site is the Gurogu area of Seoul city, an industrial district where an industrial complex and residential areas are located and which is mainly underlain by gneiss of Precambrian age.

Groundwater samples collected from these districts were analysed for chemical constituents. An attribute value files of chemical constituents of groundwater and the spatial data layers were constructed and pollution properties were investigated to establish out spatial relationships between the groundwater constituents and pollution sources using geographic information systems (GIS).

Florida Keys Canal Project Tackles Water Quality Degradation With GIS


click to see enlargement
The Florida Keys island chain.
(GIS) Hundreds of thousands of people flock each year to the Florida Keys for world-class fishing, diving, and the breathtaking scenery. The Keys stretch 110 miles from Key Largo to Key West and are home to about 80,000 people. Because residents desire homes adjacent to the water with dock space for boats, finger canals have become an essential characteristic of Keys life. Today there are 481 canals, totaling 111 miles, in Monroe County (groundwater).

Monroe County officials are concerned about water quality degradation in the canals. According to George Garrett, director of the Monroe County Marine Resources Department, there are currently about two dozen county canals with no access to open water—they remain plugged due to changes in environmental regulations imposed in the 1970s.

Residents have also long reported a problem with flotsam entering open canals with the accumulating seaweed decaying and fouling the waterway.


Challenge

seaweed in a canal
Seaweed and flotsam buildup in a Florida Keys canal.
To date, there has been no systematic monitoring of canal water quality in the Florida Keys. To evaluate what type of remedial actions may be necessary for the canals, ESRI Business Partner MACTEC Engineering and Consulting, Inc., was awarded a contract to undertake a survey of canal conditions throughout the Keys.

The goal of this project was to bring as much information as possible into a single GIS on the physical characteristics, potential pollution sources, and existing water quality of each of the canals.

MACTEC utilized ArcView to not only compile, process, and relate the existing data but also to generate extensive attribute data for the residential canals. With the canal inventory complete, ArcView software's spatial querying capabilities proved to be key throughout the assessment and analyses process.
Canal Inventory and Data Development

MACTEC spatially located the residential canals through a process that began with digitizing all water bodies from the 1998 aerial photographs of the Florida Keys, obtained from Florida Department of Transportation District 6 and available as part of the Florida Geographic Data Library 1:24,000 black and white aerial photography.

The aerial images were selected because of their relatively high resolution and extensive coverage of the study area. After digitizing the water bodies, MACTEC performed quality control through select field verifications, interviews with local home owner associations, and distribution of the water body layer to local agencies for comments. During this task, the layer was refined to include only the residential canals located within the Florida Keys, which were the focus of the study.
click to see enlargement
Residential canals color-coded by recommended canal treatments.
After the polygon layer representing the residential canals was created and verified, ArcView was used to populate the attribute table with physical characteristics that could potentially impact water quality in the canals.

These attributes included canal area, width, length, number of mouths, degree of convolution, and latitude and longitude of the centroids of the canals. The number of convolutions was determined by measuring the number of 90-degree turns, or fractions of 90-degree turns, in the canal.

The existing data that had been gathered, inventoried, and evaluated during an extensive data compilation effort was processed and input to the project GIS and related to the residential canals. Information varied from topography and land use information to water quality data dating back 40 years.

The water quality data was particularly challenging to incorporate, as historically it had been developed on a project by project basis that included only small sections of the Keys. Many of the source data sets lacked a complete metadata record of the methodologies and instrumentation used.

Although the historical water quality data was of value to see general trends in parameter variability, it was impossible to compare many data sets that were collected using different (or undocumented) methods. The data quality control review included a review of methodologies and documentation. Only data with comparable methods and documented protocols could be confidently compared between different monitoring stations over time. A separate GIS layer was provided as a point file of existing water quality monitoring station locations and linked to the sampling data.

Canal Assessment and Analyses

With the residential canal inventory complete and the GIS data set developed, ArcView software's spatial querying and analyses capabilities were used throughout the canal assessment process.
click to see enlargement
The 11 convolutions in the Port Largo Canal system.
MACTEC collected sufficient information, through GIS analysis of physical attributes, to evaluate potential impacts to water quality without the cost of a large-scale field sampling effort. For example, the number of convolutions and the length of a canal were used to estimate a canal's ease of circulation with adjacent nearshore waters. 

A classification model for the canals was created with canals queried and grouped by common physical characteristics. MACTEC developed a method to determine estimated water quality for each canal based on its classification, and the soundness of the developed methodology was verified by comparing the estimated water quality with the actual water quality where data was available. The values agreed, and water quality could then be estimated for all canal systems without a large-scale field effort.

GIS was also used to develop a strategy for selecting the canal specific treatment approaches and technologies that would improve water quality. ArcView was again used to query the physical attributes, which were the major factor in determining the most applicable and cost-effective options. The process also presented a methodology for prioritizing canals based on available funding or immediate interest of local residents to "do something" to improve canal water quality.

As a final step, ArcView was used to identify data gaps and recommend the type of canals Monroe County should sample if it decides to conduct a field sampling effort.
The Bottom Line

Management of residential canal water quality will become increasingly important to Monroe County as build-out of the Florida Keys continues. A comprehensive and systematic approach to canal mitigation will be necessary to prevent long-term impact on adjacent marine resources.


click to see enlargement
A water quality parameter data report is linked to each canal.
"This report will give us the necessary tools to fully understand the situation and come up with cost-effective solutions," Garrett says. "We anticipate implementing many of these technologies in the near future because different solutions will be required for different areas throughout the canal system. Now that we have a full understanding of the situation, we can also launch a public outreach program so canal residents can be educated."

ArcView has helped Monroe County establish a methodology for grouping canals by design features most likely to impact water quality, thus providing a method for assessment of treatment technologies for individual canal systems. (Source: ArcNews, ESRI)


By Wendy Leonard, Project Manager, and Karen Zahalka, GIS Manager, MACTEC Engineering and Consulting, Inc.
For more information, contact George Garrett, director of the Marine Resources Department, Monroe County (tel.: 305-289-2507, e-mail: garrett-george@monroecounty-fl.com); Wendy Leonard, project manager, MACTEC, Inc. (tel.: 305-826-5588, e-mail: wcleonard@MACTEC.com); or Karen Zahalka, GIS manager, MACTEC, Inc. (tel.: 770-421-3447, e-mail: kazahalka@MACTEC.com).