 As well as being a valuable tool in the monitoring network design, GIS was heavily used to generate figures that have been used in reports and presentations to a variety of federal agencies, potential private funding sources, and local ranchers. |
The Klamath Basin Rangeland Trust (KBRT) was created in response to the current water crisis in the Klamath Basin, a large drainage basin that is located in southern Oregon and northern California in the western United States. The water crisis was widely publicized in the summer of 2001 when the need to supply sufficient water resources to endangered and threatened fish species (including the Klamath River coho salmon, interior redband trout, bull trout, Lost River sucker, and shortnose sucker) resulted in the shutdown of irrigation water to farmers in the Klamath Project Irrigation District and the loss of their crops. The goal of KBRT is to increase the quantity and quality of water available for use by both farmers and fish in the basin by changing land management techniques and conserving irrigation water high in the Upper Klamath Basin.
KBRT has focused its efforts in the Wood River Valley, a small drainage area in the Upper Klamath Basin. The majority of land in the valley is currently used for high-density cattle grazing, which is supported by extensive irrigation and drainage systems that divert water from the spring-fed creeks and rivers onto pastures and that drain the low-lying, wetland areas, allowing cattle to forage. Although this valley makes up only 5 percent of the land area in the upper watershed, almost 25 percent of the water supplied to Upper Klamath Lake originates in this valley due to the high density of artesian springs. KBRT focused on the Wood River Valley because, with such a large amount of water originating from a relatively small area, land use changes by only about 15 ranching operations could significantly augment water supplies to Upper Klamath Lake and other downstream water needs. In 2002, KBRT implemented a new land and water management plan to achieve three goals:
- Increase the quantity of water discharged from the Wood River Valley.
- Improve water quality in the Wood River Valley and Agency Lake.
- Restore pastures and wetlands to maximize ecological value.
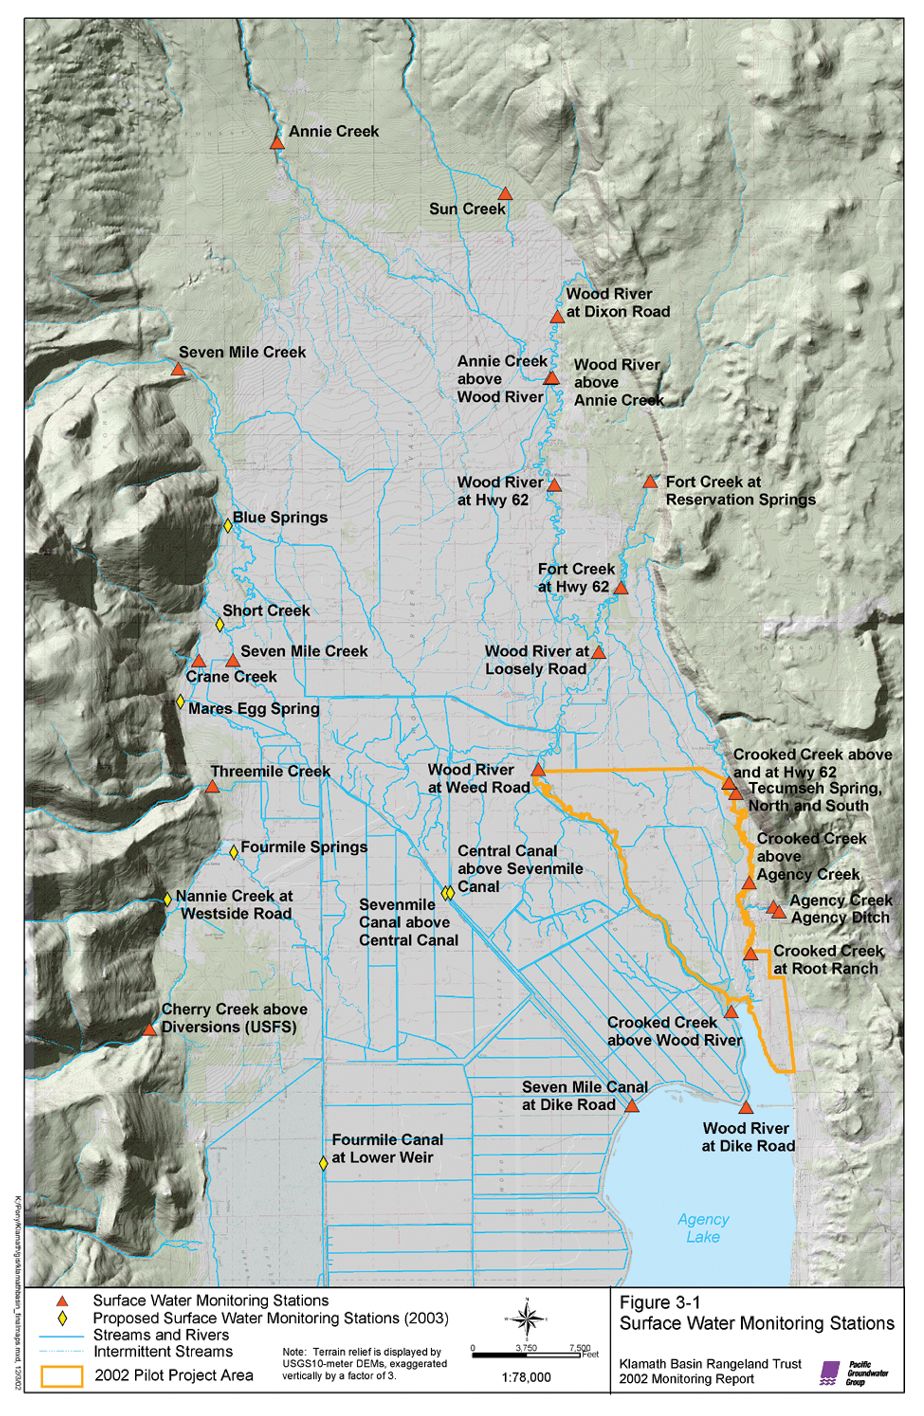
Since the KBRT project was still in the early phases of development, only limited funds were available to purchase monitoring equipment. However, it was necessary to design an extensive network to fully evaluate the benefits of the management plan in the pilot year. As a result, hydrologists designing the network wanted to maximize the amount of information gained while minimizing the number of gauging sites installed. In addition, the locations available for installing gauging sites were limited to public rights-of-way and ranch lands that were participating in or supportive of the KBRT project. A basemap was built in ArcView 8.x, using data available from the Oregon Geospatial Data Clearinghouse (www.sscgis.state.or.us). Digital elevation models (DEMs) were also downloaded, merged, and exaggerated to create a hillshade that clearly showed the Klamath Basin. The TOPO! Data and Image Support Extension from National Geographic was used to overlay United States Geological Survey (USGS) 7.5-minute quadrangle maps. Once generated, the basemap was used in selecting ideal sites for monitoring stations. As such, GIS was an invaluable tool for locating potential gauging sites, since land use, land ownership, roads, streams, lakes, and irrigation systems could be cohesively analyzed.
The selection of surface water gauging stations was further complicated because the hydrologic system in the Wood River Valley is complex. GIS helped to identify the locations of stream inflows and points of irrigation diversion. The elevation data available with GIS helped to improve the understanding of where irrigation return flows reach the streams and lake. This evaluation of the hydrologic system was used to locate surface water gauging sites above and below points of diversion on the most important stream channels, while simultaneously limiting potential sites based on property ownership. Once the final monitoring station locations were selected, the station locations were captured with the use of a GPS in the field and mapped as an event theme.
One key component of the project was to model the effects of irrigation on the hydrology of the valley. Although the model was run using software that the hydrogeologists were most familiar with, ArcView was key in generating data used to set up this model and map the results. To delineate the model boundary a new theme was created based on selected river segments from existing hydrographic layers using the transfer selected feature option in XTools. These segments were connected through heads-up digitizing. The ends of arcs were cleanly joined using the snap tool, and the line features were then converted to a polygon, using XTools, to create the final model boundary.
The model boundary was then divided between irrigated and nonirrigated lands using the Split Feature script downloaded from ESRI's support page. Areal measurements were calculated using the XTools extension. The general slope of the terrain needed to be determined also, as model input. This was calculated by obtaining elevations from the underlying DEM at specific stream locations along the model boundary.
Finally, all model data was converted to .dxf format using the ExportDXF with attributes extension downloaded from ESRI's ArcScripts Web page (arcscripts.esri.com). The final basemap was created using both ArcView 8.x and ArcView 3.x.
As well as being a valuable tool in monitoring network design, GIS was heavily used to generate figures that have been used in reports and presentations to a variety of federal agencies, potential private funding sources, and local ranchers. Since many of the people involved in the KBRT project are located on the east coast of the United States and are unfamiliar with the Wood River Valley, maps of the monitoring locations created from ArcView 8.x were a key tool for presenting the project to regulatory and agency officials.
James Root, a member of the Board of Directors for KBRT, notes, "The maps created for this project were essential for my understanding the complexities of the scientific monitoring network."
In addition, the maps have been widely used to help gain support for the project since they place the project in context and show the large amount of work being done to evaluate its success.
"People are constantly amazed by the scope and scale of the KBRT project when I am able to show them the details of our work on the GIS maps," says Root. The enhanced cartographic capabilities of ArcView 8.x made it possible to show details of background data to orient the user, without overshadowing the main theme of each map. (Source: ArcNews, ESRI)
For more information, contact Marie Mills, GIS specialist (e-mail: marie@pgwg.com), or Chrysten Lambert, geologist/hydrologist (e-mail: chrysten.lambert@kbrt.org) at the Pacific Groundwater Group, or visit the Pacific Groundwater Group Web site (www.pgwg.com).