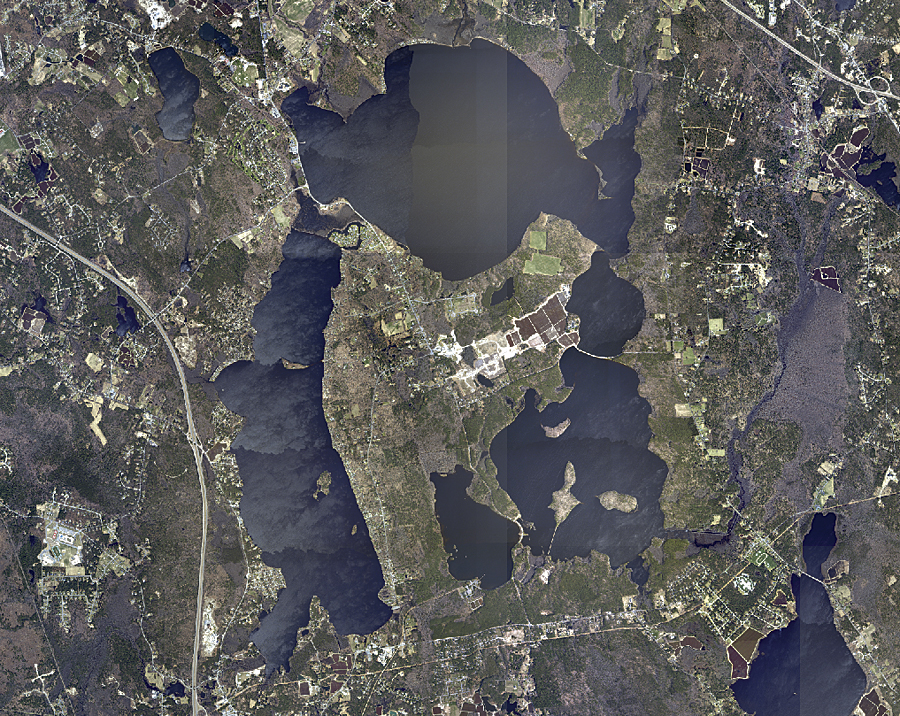
 Satellite image of New Bedford's Five Pond System. |
The opportunity to employ GIS for bathymetric surveying was based on the need to provide output data to the customer. During summer 2008, the Advanced Technology and Manufacturing Center (ATMC) at the University of Massachusetts Dartmouth was approached by the City of New Bedford to survey a reservoir pond system, which they decided to jointly conduct using AUVs. ATMC was already using ArcGIS for several projects with the City of New Bedford and decided to exploit this software to ingest, archive, and process the vast amounts of data collected by the AUVs. This technology offered a cost-effective method to obtain accurate and up-to-date information on the pond system and a level of detail not previously possible.
The methodology used in this assessment made use of multiple Iver2 AUVs' sampling capacity, providing tens of thousands of data points per pond, compared to less than 100 sampling points as used in the manual depth hydrographic survey performed over a century ago. Modern GIS interpolation techniques provide an evaluation of a pond's bathymetric features by creating a high-resolution assessment of the pond's geometric characteristics. In doing so, the volume calculation techniques are more accurate than traditional methods, and a confident assessment can be provided. Prior to the development of this technology, updating bathymetry data required hundreds of manually obtained depth readings at a huge labor cost with results far less accurate than what was accomplished using ArcGIS and modern AUVs.
Data was collected using the AUV technologies mentioned above, and analyses of the results were done using a combination of existing and custom-developed software tools.
Benefits of the Merger of Technologies
 This shows the New Bedford pond system with bathymetric overlays. |
The concept of summing all scattered points to find the average depth will produce a biased result since the data is not uniformly distributed. ArcGIS provides tools that can approximate a uniform distribution of the depth measurements. By collecting thousands of depth samples per pond, the ATMC team was able to estimate the depth values at uniformly distributed locations. To produce an average depth estimate for the pond, depths at uniform locations are required. By collecting the depth values measured throughout each mission within a given boundary (the surrounding edge of each body of water), the GIS was then used to produce the pond floor through an interpolation process that essentially considers nearby points and trends. From here, the software assigns estimated depth values as a pixelated area across the entire region of the pond. Having created a uniform distribution, an assessment of average depth can be made based on the number of points factored and the accumulated depth. The interpolation methods used provide an accurate way of estimating the average depth.
Interpolating Data
Once the physical data collection is completed, the GIS provides postprocessing analysis, allowing the user to translate the data into a visual rendering. The GIS produces a layering of the entire study area on its global mapping system. Given the data, ArcGIS provides a variety of interpolation methods that estimate the unknown values for the entire study area. The goal is to create surfaces that represent an accurate and logical depiction of the data. Any location's values are estimated based on the values of points nearby. By using a selection of embedded algorithms, GIS converts recorded points into a practical, visually appealing depiction, simplifying a user's task of interpreting relatively complex data.
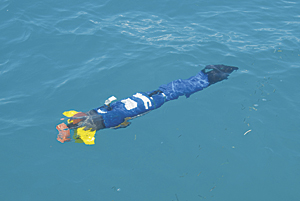 An Iver2 autonomous underwater vehicle just below the surface on a mission. |
Because the two platforms were not immediately compatible, the ATMC team developed several utilities to facilitate moving the raw data output from the AUV to ArcGIS. These utilities enable fast generation of bathymetric surfaces; the outputs were typically generated within 15 minutes of mission completion. The utilities consist of algorithms that ingest the raw data from the Iver2 and produce an ArcGIS software-compatible file format, which is then converted into a feature class, necessary for ArcGIS manipulation.
Quick and Cost Effective
The effort described here—which paired modern GIS functionality with low-cost, highly capable, person-portable autonomous underwater vehicles—demonstrated robust bathymetric surveying in ponds, watersheds, and coastal systems. This state-of-the-art technology is more accurate than techniques used in the past. Manual bathymetric sampling is slow, impractical, expensive, and inaccurate compared to the techniques used in this modern assessment. Modern GIS interpolation techniques can exploit the data collected by an AUV and provide an evaluation of bathymetric features by creating a high-resolution assessment of the pond's geometric characteristics. In doing so, the volume calculation techniques are more accurate than traditional methods and, once developed, allow quick turnaround in future surveys. (Source: ArcNews, ESRI)
More Information
For more information, contact Keith MacKenzie, project manager (e-mail: kmackenzie@umassd.edu); Flavio Fernandes (e-mail: u_f1fernande@umassd.edu), intern at the Advanced Technology and Manufacturing Center, University of Massachusetts Dartmouth; or Christopher Laliberte (e-mail: u_claliberte@umassd.edu), graduate of University of Massachusetts Dartmouth.