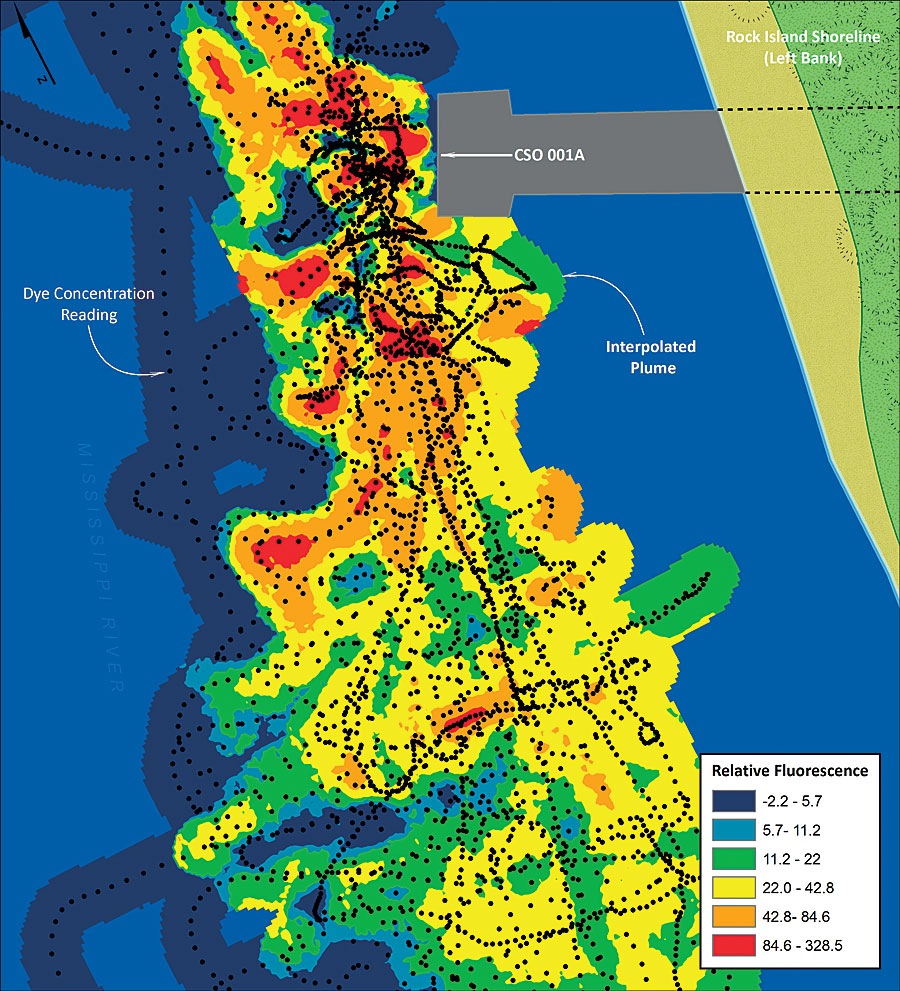
 Dye study outfall mixing results illustrated by levels of relative fluorescence present using GIS. |
Rock Island, like many other older cities in the United States, has a combined sewer system (CSS). CSSs are wastewater collection systems designed to carry sanitary sewage and storm water in a single pipe to a treatment facility.
During dry weather, CSSs convey sanitary wastewater. In periods of rainfall or snowmelt, total wastewater (sanitary and storm water) flow can exceed the capacity of the treatment facilities. When this occurs, the CSS is designed to overflow directly to surface water bodies to prevent sewage backup in the streets and/or into homeowner basements. These overflows—called combined sewer overflows (CSOs)—can be a major source of water pollution in communities served by CSSs.
Purpose
The United States Environmental Protection Agency (USEPA) brought suit against the City of Rock Island, Illinois, in August 2000 for alleged violations of the Clean Water Act. USEPA alleged that frequent CSOs caused degradation of the city's receiving water.
Symbiont, a full-service engineering and consulting firm headquartered in West Allis, Wisconsin, was retained by the city to perform a water quality modeling study. The purpose of this study was to determine the compliance of the receiving water with state water quality standards (and designated uses), assess CSO impacts to the rivers, and evaluate appropriate CSO control alternatives to be implemented as part of the city's Long Term Control Plan (LTCP). Symbiont (formerly Triad Engineering Incorporated) was selected because of its diverse capabilities and its innovative approach demonstrated in other water resource-related projects.
As part of the overall project, a dye study was planned using GIS and GPS at one of the city's CSO outfalls to characterize CSO discharges and to evaluate plume mixing and dispersion under select river flow conditions.
Since the late 1990s, Rock Island's wastewater utility has been using ArcView to manage CSS features in its GIS. However, in 2001, a major effort was initiated by the City of Rock Island and Symbiont to begin remapping and inspecting the majority of the manhole features to comply with LTCP objectives. Using ArcView, a rugged Tablet PC, and a real-time kinematic (RTK) GPS rover, field crews populated structure attributes in their GIS in real time while having instant access to additional datasets and basemap layers. Subsequent to the up-front investment costs, the City of Rock Island realized significant savings with respect to labor costs, as well as increased data integrity and accessibility using the portable ArcView system.
Prior to performing the CSS inspections, the City of Rock Island had installed an RTK GPS base station on top of one of the local water towers, and using its GPS rover, the city was capable of obtaining subcentimeter horizontal accuracy for each of the collection points. The rover was capable of picking up signals from the base station more than seven miles away. Using the ArcView Buffer proximity tool, Symbiont determined the city could easily use the same GPS/GIS integration technology while performing the dye study, without having to reestablish a temporary base station or consider more traditional methods.
Methodology
Two CSO events were planned on the Mississippi River—a low-flow CSO event and a high-flow CSO event. The CSO outfall selected to perform the dye study is located 35 feet offshore in an area of the Mississippi River that is nearly 1,000 feet across. The magnitude of the Mississippi River flow compared to any discharge from Rock Island suggests water quality impacts, if present, would be localized. Overlaying land-use layers in GIS was useful in illustrating downstream recreational river frontage, including a park and marina, and for this reason, a dye study was conducted to evaluate discharge plume mixing in the river.
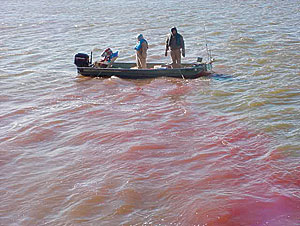 Performing dye study on the Mississippi River with GIS. |
With known underwater hazards and unpredictable currents, performing fieldwork on a boat was required. Measurement of effluent discharge from the outfall was gauged using a tracer dilution method. Symbiont senior hydrogeologist Tina Reese determined that a constant-rate injection method, where dye is injected continuously until in-stream concentrations plateau and reach equilibrium, would best model an actual discharge. In order to accurately model the entire plume, thousands of dye concentration data points were required in both the horizontal and vertical directions at locations in the vicinity of and downstream from the CSO.
A Self-Contained Underwater Fluorescence Apparatus (SCUFA) was used to log dye concentration readings every second, which provided real-time fluorescence readings. Existing dye study literature focused on small streams or rivers where data collection could easily be performed using traditional survey methods. However, to clearly depict the dye plume in the Mississippi River, many readings were required, potentially thousands. Symbiont GIS manager Ryan Eckdale-Dudley knew that GIS integration was the solution to collecting and analyzing the dye study data.
"Utilizing GPS for real-time data collection and GIS for data analysis and presentation was a perfect solution to a complex problem," Eckdale-Dudley says. He suggested integrating an RTK GPS with the SCUFA so that every second the SCUFA was collecting a dye concentration, a GPS unit would record its location consistent with the city's existing GIS. Once the data was collected, ArcView and ArcGIS Spatial Analyst could be used to identify mixing zones downstream from the outfall, and discrete data points could be converted to a raster for illustration and additional analysis.
Using the city's boat, Symbiont mounted a GPS antenna directly above the SCUFA unit. During normal discharge conditions, a metering pump was used to inject the dye at a constant rate upgradient of the outfall structure in a nearby manhole. Once equilibrium of the dye was reached, field crews navigated the boat upriver to the study area from the nearby marina. In the boat, the field crew traversed the plume, taking GPS and dye concentration readings every second until the entire plume was surveyed multiple times at various depths to evaluate horizontal and vertical mixing. Having the GPS unit connected to ArcView while performing the study provided a map of real-time sample locations, which made it possible to verify the team collected sufficient data for the entire study area. In a little over an hour, more than 4,000 data points had been recorded.
Back onshore, the datasets were combined in ArcView using the time stamp collected by each piece of equipment. With so much data in such close proximity, it was difficult to interpret the raw point data alone. Prior to the dye study, Symbiont had been leveraging the ArcGIS Spatial Analyst extension to evaluate other environmental datasets with great success. Using ArcView and ArcGIS Spatial Analyst, dye concentration data points were interpolated to raster surfaces using kriging as the statistical method. Once complete, data classification and symbology of the raster made it possible to easily visualize and perform additional analysis of the plume dispersion. Using surface analysis tools in Spatial Analyst, contours were easily created to accurately illustrate the zones of dilution. The ArcGIS 3D Analyst extension was utilized to generate triangulated irregular network (TIN) surfaces, making it possible to create cross-sectional plume profile graphs using ArcGIS 3D Analyst.
Results
Based on the results of the dye study, the city was able to document that wastewater discharged to the receiving stream during a CSO event was dispersed and well mixed within 150 feet downstream from the outfall and that the maximum plume width was less than 50 feet from the outfall structure. It was also noted that the main navigational channel acted as a barrier to plume migration to the opposite bank, thus making the plume unable to impact water quality on the Iowa side of the river. These results helped determined long-term CSO control alternatives for the city's planning strategies.(Source: ArcNews, ESRI)
More Information
For more information, contact Dale Howard, utilities superintendent, City of Rock Island (e-mail: Howard.Dale@rigov.org); Ryan Eckdale-Dudley, GIS manager, Symbiont (e-mail: ryan.dudley@symbiontonline.com); or Tina Reese, senior hydrogeologist, Symbiont (e-mail: tina.reese@symbiontonline.com).